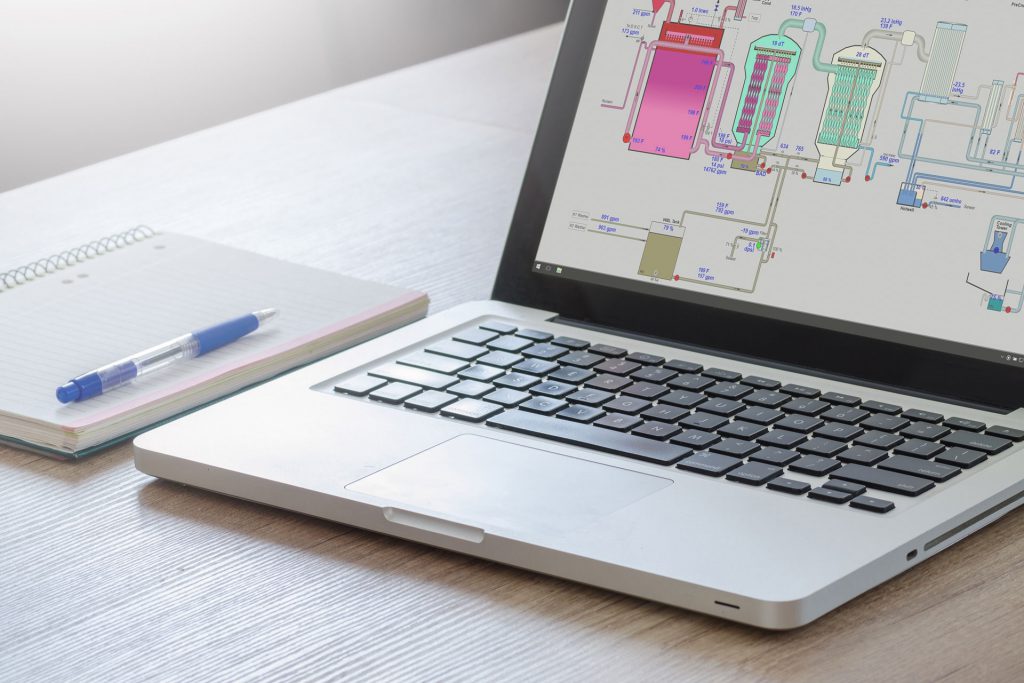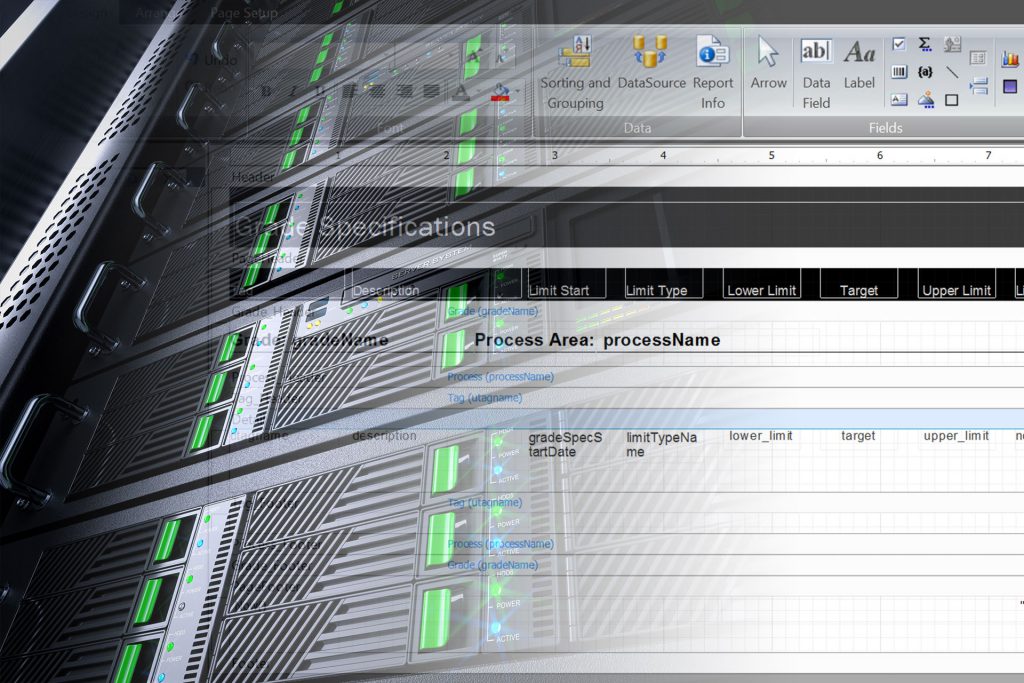
Industrial Energy Monitoring in Manufacturing
All forms of commerce require energy and industrial energy monitoring is essential. Industrial processing facilities ...

Rethinking Data Compression For Process Historians
Most people are familiar with compressing data files so that they require less memory and ...
2018 dataPARC User Conference – A Recap
The 2018 dataPARC User Conference was a success! Held in Portland Oregon from October 15-18, ...

Process Alarm Management Best Practices
The purpose of process control alarms is to use automation to assist operators as they ...

Easily Integrating Maintenance Information With A Computerized Maintenance Management System (CMMS)
One of the challenges facing industrial process along their manufacturing digital transformation is the growing ...

What Makes Good Visualization Software For Data Historians?
There are many different systems available for storing and analyzing manufacturing process data. A historian is a ...
Tech Terms Part II
As mentioned in our previous article, technical terms continue to change and evolve. Below are more terms we found useful to know and understand and think you will, too.
Five Reasons You Should Attend The 2018 dataPARC User Conference
It is that time of year again, time to gather with your peers and talk about some of the great benefits of dataPARC software. This year’s dataPARC user conference will be held at the Sentinel Hotel in Portland, Oregon from October 15- 18-2018. Besides getting to learn in a beautiful setting (Portland, OR in the fall – gorgeous!) the following are five reasons why you should attend:

Soft Sensors In The Process Industry
The process industry is an industry that is consistently changing as processes are refined and ...
Tech Terms Today – What The Buzzword Was That?
Buzzwords have always been a part of technology but recently it seems the usage has exploded. At the same time usage is growing, the terms themselves have changed and evolved. Many contemporary terms now include a wide spectrum of meaning in their definitions, applying to new applications and solutions brought to market. In some cases, you’re also seeing very liberal use of terms for marketing and sales. From our perspective, the more we can all talk a common language and the more we realize many terms are replacing old concepts, the better off we will be.

Aggregating Manufacturing Data for Accurate Analysis
The first step toward understanding and optimizing a manufacturing process is to collect and archive data about the process. Ideally, the system used to accomplish this is a ”plant wide” information system, or PIMS, which collects not just process data, but also quality information and laboratory results, and operations information such as upcoming orders and inventory.

Advantages Of A Plant-Wide Information System
When it comes to operating a continuous manufacturing process of any kind, it is beneficial ...
A Guide To Reporting And Notifications With A Data Historian
Historian packages were originally intended to be a support tool for operating personnel. Current and historical data was constantly displayed on a dedicated screen next to the primary control screens, and users were intended to interact with it at that location more or less continuously. As the historian became a one-stop source for all types of data throughout a facility, it became a tool that could benefit supervisory and management personnel as well. This led to the development of a variety of remote notification and reporting tools to meet the somewhat different needs of these individuals.
Benefits Of Calculated Variables
As an engineer in a manufacturing facility, you are excited that management has purchased and implemented a plant wide Information Management system, or PIM. This gives you the ability to collect and store process data, and to display both real time and historical process graphs which allow you and the operators to better understand the process. You can finally trend important process variables next to each other in order to visualize relationships that you suspect exist, and to use historical data for accurate diagnosis of problems, for example, was it lube oil pump failure, or loss of cooling water that led to the recent shutdown of a compressor?
What Makes A Great User Interface?
We all experience user interfaces on a daily basis whether in our cars, on our mobile phones or on our personal or work computers. A user interface is a gateway; it is a visual path to an experience as well as information or functionality. A user interface is also a language of its own that allows one to navigate a program or application.
The 2017 dataPARC User Conference Was A Networking And Learning Success Story
Over 121 people gathered for the 2017 dataPARC User Conference in beautiful Portland, Oregon from May 15 through the 18th. Attendees traveled from Canada, South Korea, Taiwan, Thailand, China and Lebanon to experience the presentations, networking and training.
Version 5.5.2.1 – Get The Scoop On This Minor Release
This version is a minor release improving on the features in the 5.5.2 series. NEW FEATURES Centerline Added ability in Centerline Config to select a tag and then share it’s process to all tags in the Centerline. PARCmodel DMODXN/HT2N contribution tags will now be created for each of the input tags, allowing tag contributions to be viewed over time.

Static, Live Or Dynamic – Which Report Is Best?
In the digital age there are so many options for how to best share information. ...
Welcome To 5.5
Coming off nearly another year of sleep deprivation our developers are pleased to announce the completion of PARCview’s next major version, 5.5! Similar to the WPF expansion in our last major release, 5.5 is packed with new tools and treats that have our engineers salivating! From graphic logic controls to the new PARCview Configuration Manager we will take a closer look at some of the great new features in this release.
Why We’re Implementing The OPC UA Spec. – And How It Will Benefit Our Customers
Going back 15 years now, dataPARC had the notion of a “Process Area” that allowed tags from multiple systems to be organized by Asset, providing filters (like Grade or Product) for all tags assigned to an Asset and for other useful associations to be applied globally. Building on this experience, the next major version of PARCview takes the next step in Asset Management and includes an adoption of the ISA 95 companion specification to OPC UA. The implementation will allow end-users a familiar, standards-based architecture for organizing their plant data.

OPC UA: A Framework For The Industrial Internet of Things
The ISA 95 spec and OPC UA companion standard provide a model that allows software programs to exchange all the relevant information throughout a manufacturing organization. This provides the groundwork for an industrial internet of things by breaking down the communication barriers between objects.

Using Process Displays For Troubleshooting
A lot of time and effort goes into the construction of the HMI screens and ...
Convince Your Boss To Send You To PARCtraining: 4 Strategies That Will Work
The New Year is starting and now is the time to book your PARCview training session. With the new training calendar rolling out this is the perfect time to plan your get-a-way to the Northwest. Whether you need to escape the heat of summer, the cold of winter, or just need to get away from the plant, PARCtraining is your ticket to a welcome escape. Oh, did we mention the training?

Unlocking Better Process Display Performance Using WPF and XAML
Most of us take for granted the rapid advance of “technology”. Computers get smaller and ...

Data Historian Reporting Best Practices
Historian packages were originally intended to help operators and engineers understand and operate manufacturing processes. Current and historical data was constantly displayed on a dedicated screen next to the primary control screens, and users were intended to interact with it at that location more or less continuously. As the historian became a one-stop source for all types of data throughout a facility, it became a tool that could benefit supervisory and management personnel as well. This led to the development of a variety of remote notification and reporting tools to meet the somewhat different needs of these individuals.

Benefits Of Calculated Variables In Process Manufacturing Analysis
As an engineer in a manufacturing facility, you are excited that management has purchased and ...

Process Control Loops: Trending PV, SP, OP And Mode
Modern manufacturing and process industries are often largely run by distributed control systems (DCSs), with minimal input from operating personnel. This has largely been made possible by the evolution of computer and controller hardware and software.
