Modern manufacturing and process industries are often largely run by distributed control systems (DCSs), with minimal input from operating personnel. This has largely been made possible by the evolution of computer and controller hardware and software.
The basic building block of a process control systems is the process control loop. Process control loops utilize sensors, transmitters, calculations or algorithms, processing systems, and actuators or outputs. Their ultimate goal is to help a process run in a stable, predictable, consistent manner. Some common examples of process variables that are controlled by control loops include tank levels, liquid flows, air temperatures, and steam pressures. Control loop monitoring and tuning is critical for manufactuers.
A large industrial processing facility, like an oil refinery or paper mill, utilizes thousands of process control loops. This type of facility also typically utilizes a data historian to store data related to their control system or systems, plus other significant data. This data contains a wealth of information that can be used as a powerful troubleshooting or optimization tool. The trick is knowing how to use it.
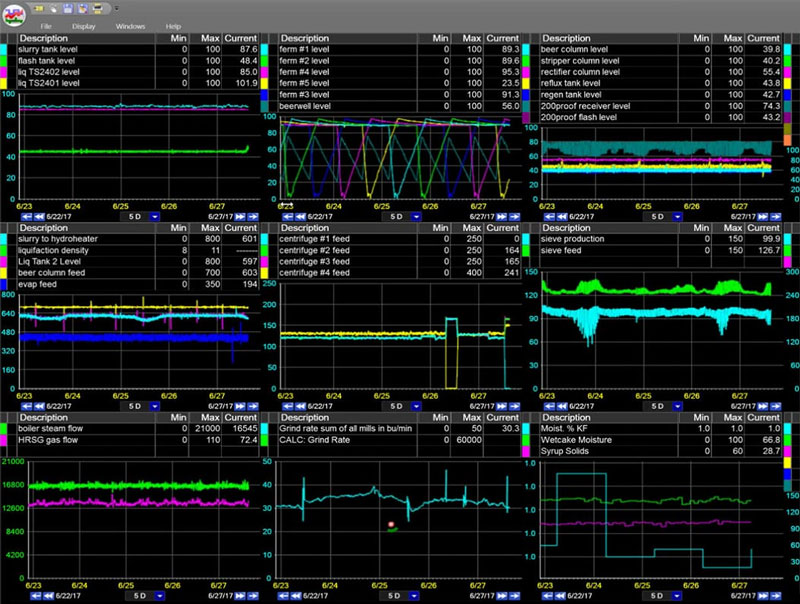
Monitor and analyze your process control loops on one screen with PARCview’s Multi-Trend display.
What Is A Process Control Loop?
Before we delve into some of the ways data can be used, it is important to understand the process data that is typically available. We’ll begin by describing the elements of a very basic process control loop and then the data it generates. More complicated control loops are also often used, but a thorough description of all possible control loop types is not necessary here.
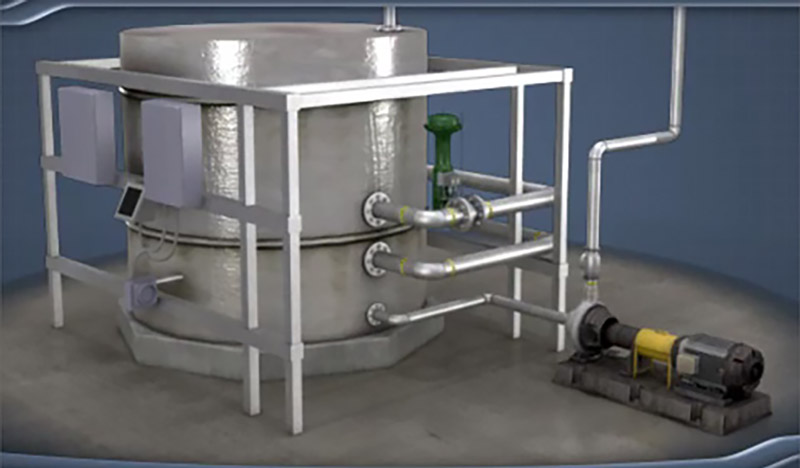
The temperature of a fluid in a tank can be automatically controlled by a process control loop using steam.
A simple single-input-single-output (SISO) feedback control loop consists of following:
Process Input
An outside variable that affects a process. In a control loop, you must be able to control and manipulate this variable. For example, the steam flow into a tank could be the process input in a control loop controlling the fluid temperature out of a tank. (Note that the process input is sometimes referred to as the “input variable.”)
Process Output
A characteristic of the process that affects the outside world. In a process control loop, this must be measurable and vary in a consistent way with the process input. In the tank temperature control example, the temperature of the fluid exiting the tank would be the process output. (The process output is sometimes referred to as the “output variable.”)
Setpoint
The desired value for the process output. In the tank example, this is the desired temperature of the fluid.
Controller
The hardware and software which compare the measured process output to the setpoint, and calculates if the process input needs to change and by how much. The controller then sends a signal to an actuator to make an adjustment to the process input, if necessary. In the tank example, this could be an actuator on a control valve on the steam line to the tank.
What Type Of Data Do Historians Store?
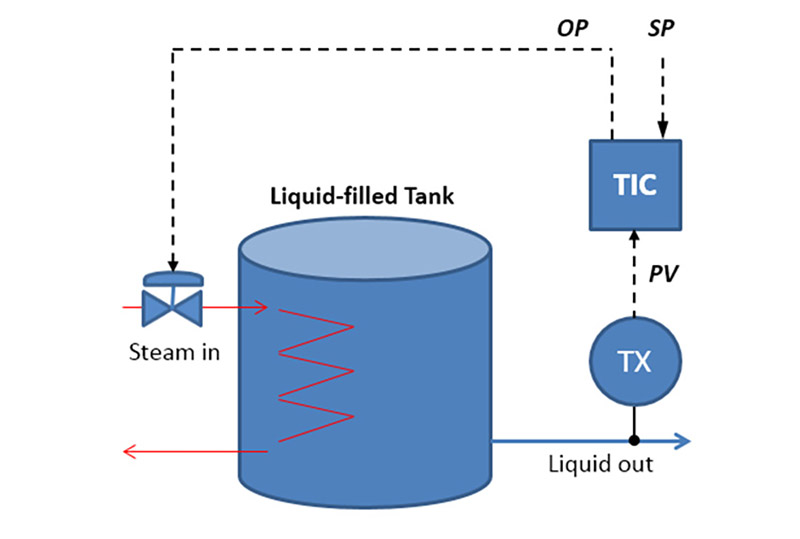
The temperature indicating controller (TIC) compares a process variable (PV) value to a setpoint (SP) value, and calculates and sends an output (OP) signal to the steam flow control valve.
The process data associated with the tank temperature control loop in a data historian would include:
PV or MV
The process variable or measured variable. This is the measured value of the process output – in this case, the temperature of the fluid exiting the tank. This value is transmitted from the sensor to the controller.
SP
The setpoint value, which is the desired value for the process variable (PV). The desired setpoint value can be entered by an operator, or it can be calculated or based on a signal from an outside source.
OP
The output from the controller. The output signal is transmitted from the controller to an actuator to make an adjustment, if necessary, or it can be sent to another controller (this is described in greater detail in the next bullet).
Check out our advanced analytics tools & see how you can quickly optimize your processes.
Mode
This determines when and how a controller works. The three most common controller modes are Automatic, Manual, and Cascade.
In Automatic mode, the controller receives the setpoint value (SP) and the measured value of the process variable (PV), and calculates and sends an output signal (OP) to the actuator.
In Manual mode, the controller is overridden, allowing operating personnel to send the output signal (OP) directly to the actuator.
Cascade mode is similar to Automatic mode, except the controller receives its setpoint (SP) from an outside source, usually another controller. To help illustrate this concept, imagine in our tank example if the temperature controller sent an output (OP) signal to a steam flow controller instead of a valve actuator. The steam flow controller would receive a setpoint (SP) from the temperature controller, plus a PV signal from a flow meter on the steam flow into the tank, and calculate and send an output signal (OP) to the actuator. This “Cascade” control strategy would improve the temperature control response because it would largely remove outside influences, such as variations in the steam supply or any control valve non-linearity. (Note that this is no longer a simple single-input-single-output control loop.)
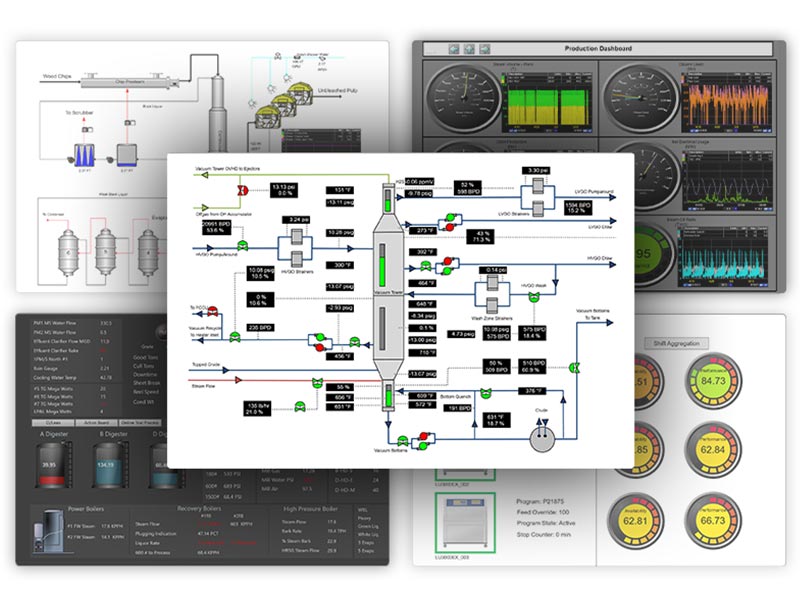
Real-time manufacturing operations management and industrial analytics tools
Process Monitoring
During production, operating and supervising personnel can monitor current and time-trended process variables (PVs) to monitor processes. Current PV values can be displayed on DCS graphics or other computer-based graphics applications, while time-trended values can be viewed using a trending application.
Many data historians (like dataPARC) have graphics applications and trending applications (i.e. PARCgraphics and PARCview) to display process data. The most useful trending applications allow multiple variables to be displayed on each trend and multiple trends to be viewed on a single screen. This can be very helpful when trying to correlate data or troubleshoot a problem.
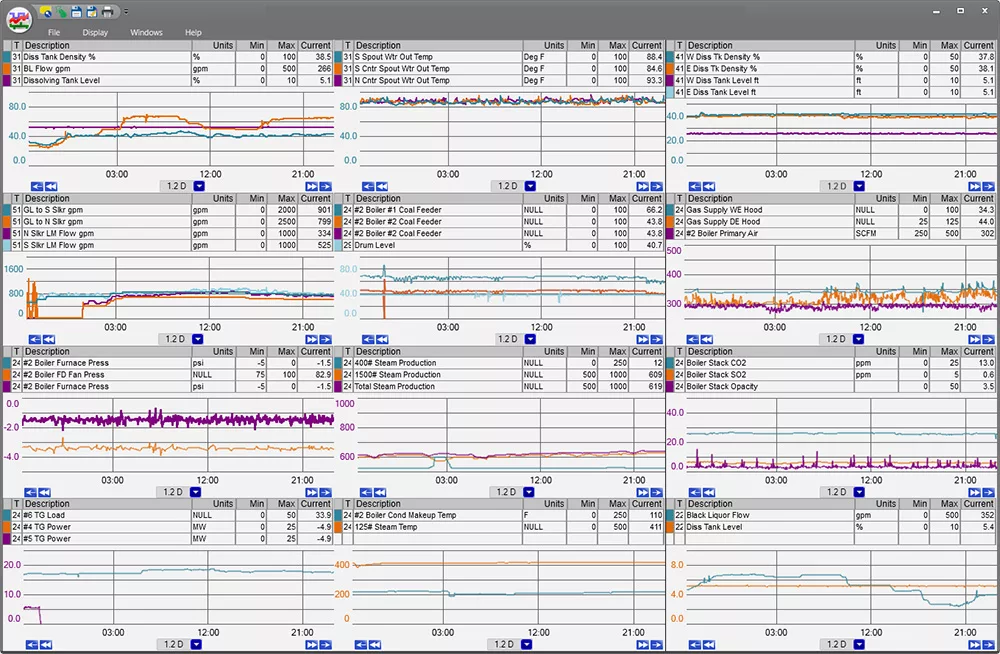
dataPARC’s PARCview displays can include multiple variables on each trend and multiple trends on each screen for any available data over any time period.
Key process variables that are frequently monitored include chest and tank levels, steam and liquid temperatures, steam and oil pressures, and liquid and gas flows. The only requirement is that the monitored characteristic be measurable, so pH, conductivity, and turbidity can be monitored, while odors and tastes currently cannot.
The advantage of time-trended data displays vs. single-point data displays is that in addition to seeing where the process is currently, you can also see where the process has been and where it is headed. This is extremely valuable in facilities processing large volumes of product, because control changes can take a long time to take effect.
Tuning Control Loops
Another valuable application of process data is tuning of control loops. Without going into too much depth, tuning a control loop involves adjusting numerical values in the controller’s calculation to optimize the controller’s output (OP) response to process disturbances or to changes in the setpoint (SP). Tuning can be performed manually or automatically by tuning software.
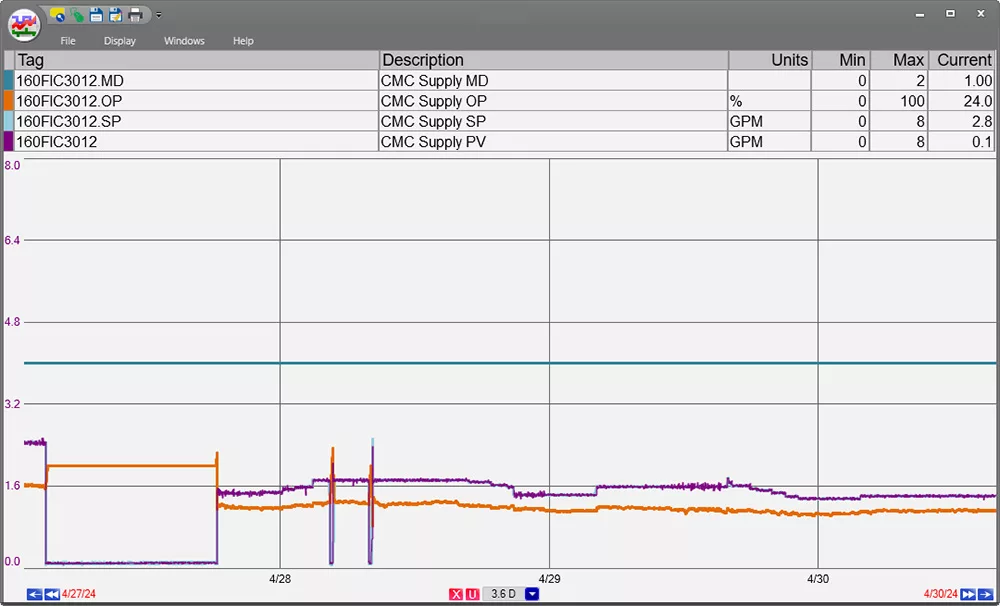
A good trending application is essential to manual control loop tuning – preferably, one that allows the SP, OP and PV to be trended together on a single trend. Trending applications are also useful for spot checking of control loops, because loops sometimes require tuning adjustments. Advance software, like CONTROLsuite can assist with control loop monitoring and tuning.
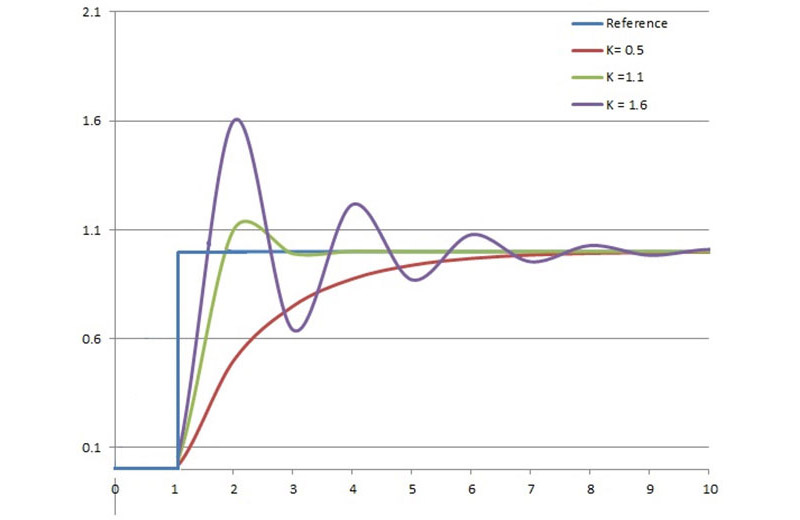
This particular trend shows three control loop tuning attempts. The blue line is the setpoint (SP) value. It shows when and by how much the setpoint was changed. The purple, green, and red lines show how the process variable (PV) responded to three different sets of tuning constants. In the purple attempt, the controller reacted quickly to the setpoint change, but the PV response overshot the setpoint quite a bit. At the other extreme, the red attempt, the controller was much slower to respond but there was no overshoot. The desired response of PV depends a lot on the process being controlled. For each control loop, you need to decide how much overshoot is acceptable, and how quickly the process variable needs to reach the setpoint.
On the road to digital transformation? Get our Free Digital Transformation Roadmap, a step-by-step guide to achieving data-driven excellence in manufacturing.
Troubleshooting
Last, but not least, trends of PV, OP, SP, and Mode can be invaluable when troubleshooting process upsets and disturbances. The ability to observe measured values for multiple process variables (PVs) over time allows correlations to be determined, which assists with root cause analysis.
Plotting multiple process variable (PV) values on a single trend can help identify correlations between them.
Time trends of the other process control values can also be helpful:
- Setpoint (SP) trends reveal the changes that have occurred to operator-entered setpoint values and calculated setpoint values. This is valuable because unauthorized or unwarranted setpoint changes can lead to process instabilities and upsets.
- Mode trends show when controllers have been put into Automatic, Manual and Cascade modes. Like setpoint changes, mode changes can lead to process instabilities and upsets.
- Controller output (OP) trends can reveal problems with equipment or the process. For example, if a previously functioning control loop has moved to an output of 0% or 100%, and is failing to meet the setpoint, that is a good indication of an equipment malfunction or a change in the process.

Trending packages like PARCview, which allows trending process data quickly over very long time frames – one or more years – and also allow the user to zoom in and out on the data, are especially helpful during troubleshooting efforts. Coupled with next generation software like CONTROLsuite , users can get real-time insights into loop performance, fine-tune operations and identify issues before they escalate.
Want to Learn More?
Download our Digital Transformation Roadmap and learn what steps you can take to achieve data-driven success in manufacturing.