PARCview
Real-Time Manufacturing Analytics Software
Enable data-driven decision-making on the plant floor and across your enterprise. Improve your company’s decision-making and troubleshooting capabilities with our real-time manufacturing analytics software.
Get Connected
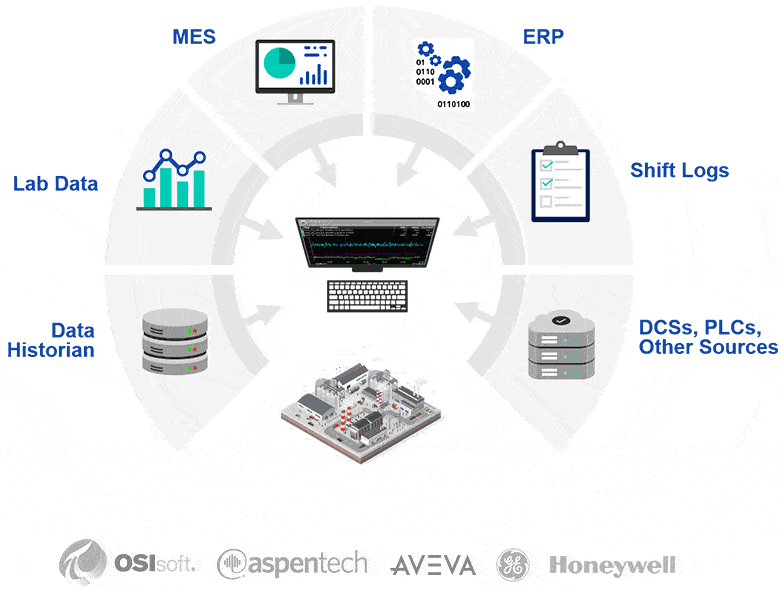
PARCview provides a single source of truth for all your manufacturing data. Aggregate disparate data from machines and manufacturing systems such as ERP, MES, lab, & quality systems, to develop the insights that drive continuous improvement.
- Integrate data from any source. Really.
- Aggregate data from facilities across the globe.
- Combine disparate data into a single trend, dashboard, or report.
- Connect via XML, SQL, Web Services, OPCHDA, & more.
- Leverage existing historians: OSIsoft PI, IP.21, Honeywell, GE, Aveva, etc.
Dive Into The Data
Give your operators, engineers, & SMEs the power to develop data-driven solutions to your most challenging process issues. Give them PARCview – the most flexible, powerful, & easy-to-use industrial analytics toolkit available.
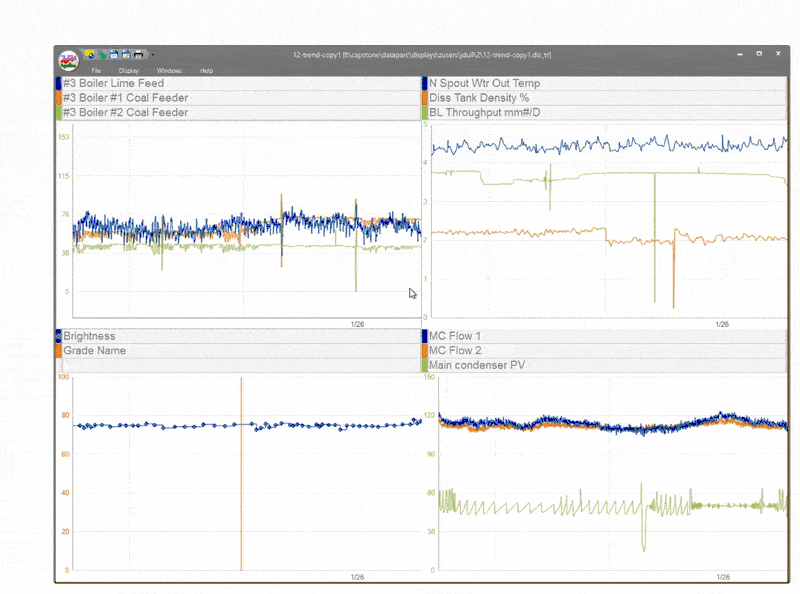
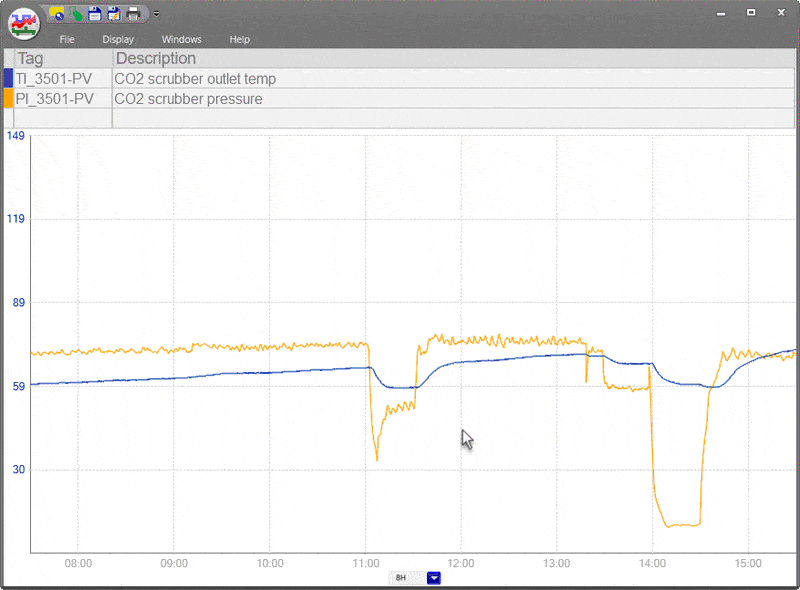
- Investigate process issues with real-time trending tools.
- Visualize data using X-Y charts, histograms, & more.
- Combine disparate data into a single trend, dashboard, or report.
- Diagnose equipment issues to improve OEE.
- Predict upcoming process issues & take action before they occur.
Produce Answers. Faster.
When process issues begin causing downtime or scrapped product, there’s no time to waste. PARCview’s high-performance archive engine returns hours, days or months of high-resolution data within seconds, so you can get right to troubleshooting.
- 200x Faster retrieval of long-term data (>30 days)
- 2x Faster retrieval of short-term data (<24hrs)
- Reduce storage. No double-storing data.
See The Big Picture
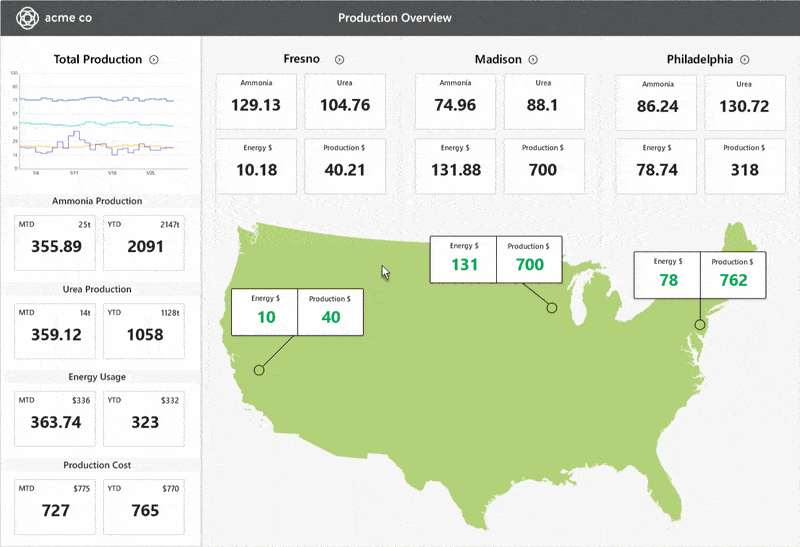
Give operators, engineers, & management insight into current operating conditions. Build real-time dashboards & displays to monitor equipment status, site-level process flows, or enterprise-wide productions KPIs.
- Configure custom displays that represent your process.
- Display data from any source (or site) in one view.
- Access dashboards remotely, from any mobile device.
- Design displays using 5000+ pre-built graphic objects.
- Import existing graphics from PI, IP.21, & more.
Put It In Context
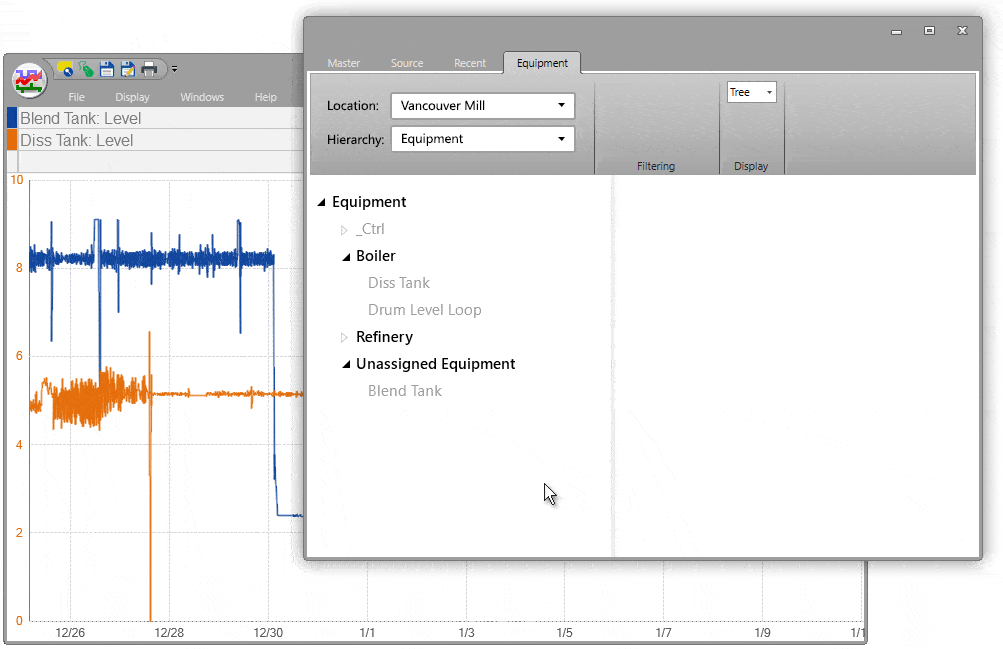
dataPARC’s Asset Hub is a framework that lets you add context to raw data. Create digital assets that represent physical objects in your plant and add descriptive labels for properties like volume, temperature, or rate, so users can easily find and compare assets.
- Organize tags by asset to find information faster.
- Compare like assets to identify underperforming resources.
- Create reusable templates for common assets (boilers, motors, etc.)
- Leverage Existing PI AF structures.
Video Tour
Real-Time Manufacturing Analytics Software
PARCview is a real-time manufacturing analytics solution developed by the end user, for the end user. Quickly transform critical data into useful information for timely decision-making and root-cause analysis.
Powering Practical Analytics Solutions for 25+ Years
We were trying to optimize the largest facility in our company and PARCview allowed us to overlay data – both lab and process – to break down perceptive barriers and make data-driven decisions.

Stan Case
Plant Manager – Amalgamated Sugar
Our investment in dataPARC is allowing us to focus on system optimization as we leverage the data we are now capturing.

Tyler Fedun
Director IT Operations – Energy Transfer
We make a lot of different different grades of paper. In order to maximize the dollars for each run, we use dataPARC’s centerline tool to find ‘golden runs’ and those become our target each time we run a grade.

Pami Singh
Director Process Optimization
The World’s Largest Manufacturers Depend on dataPARC
Related Solutions
Tackle common manufacturing challenges with PARCview’s out-of-the box functionality.
Data Integration
Establish a single source of truth for all your manufacturing data. Historian, ERP, MES, lab, & more.
Quality Control
Real-time quality control tools for continuous or batch manufacturing processes.
Additional Features
dataPARC is a flexible industrial analytics toolkit built upon the promise of easy data acquisition & integration. dataPARC’s core building blocks can be used to build any applications to meet your needs.
Dynamic Alarms & Notifications
Use dataPARC’s rule-based alarm engine to build smart alarm definitions that reliably detect compliance events, including data loss, real time, and aggregate exceedance of regulation limits. Forward alarm event data to PARCview’s Logbook, and send notifications via email or SMS.
Custom Report Builder
PARCview’s highly configurable scripting and scheduling application can schedule and deliver recurring reports or other key data to management and other decision-makers. Create event-triggered reports, dashboard report delivery, & scheduled reports.
Excel Add-In
Designed to automate common or tedious Excel tasks and make it easy to build reusable reports, PARCxla enables users to spend more time making important decisions and less time wrestling with data.
Manual Data Entry
PARCgraphics Designer’s form-based MDE tools offer a platform for constructing custom data entry screens. Enter data against a record from anywhere within the dataPARC environment, across multiple MDE pages, PCs, and locations.
Batch Analysis Tools
Arrange multiple batches by product into a comparison or consecutive view. Search for historical batches based on identifying information, such as batch ID or product label. Determine variability at any point in the batch using Run Trend analysis.
Control Charts
Build control charts (x-bar, range, standard deviation, etc.) from existing sources or PARCview formulas. Define simple min/max limits, choose from Western Electric Rules or custom logic. Limits can be managed natively in dataPARC or imported from a 3rd party database.
Download Our Overview Datasheet
Click the link below to receive a FREE overview on the benefits of using dataPARC to transform critical data into visual information for timely decision-making.