Real Time Production Monitoring Software
Monitor Production In Real Time
Monitor production performance KPIs and downtime events in real time, for enterprise-wide visibility into machine availability and the health of batch and continuous manufacturing processes.
Build Real-Time Dashboards & Displays
Empower operators, engineers, and management with insights into current operating conditions. Create real-time dashboards and displays with actionable data, utilizing a cutting-edge production monitoring system. Uncover invaluable production data and enhance machine utilization, whether monitoring equipment status, equipment effectiveness, site-level process flows, or enterprise-wide production KPIs.
- Configure custom displays that represent your manufacturing process.
- Combine data from any source (or site) into common dashboards or displays.
- Interact with dashboards & displays to drill-down into data for troubleshooting.
- Access your creations from any mobile device.
- Design dashboards & using 5000+ pre-built graphic objects.
- Import existing graphics from PI, IP.21, & more.
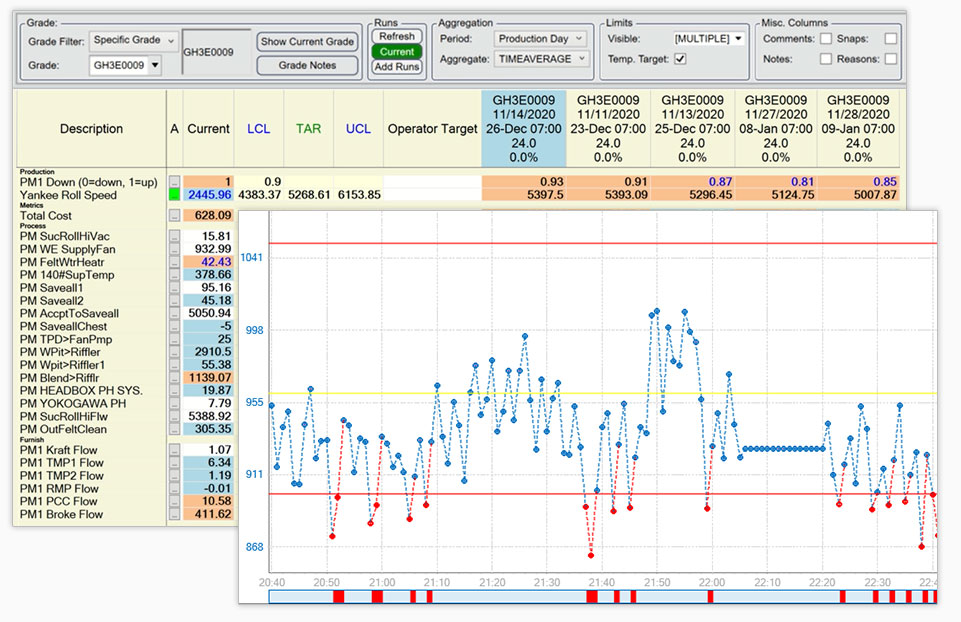
Enable Proactive Plant-Floor Decision-Making
Enhance your factory and shop floor efficiency with dataPARC’s powerful Centerline display, offering operators real-time visibility through an intuitive multivariate control chart. Proactively detect deviations and receive early warnings, allowing for immediate operator input. Operations can rely on this real-time data insight to eliminate potential quality or equipment issues, ensuring seamless operations and optimal performance.
“dataPARC’s production monitoring software has given us the ability to make decisions based on events as they occur, and in some cases, even forecast into the future.”
Steve West, Senior Process Engineer – Catalyst Paper
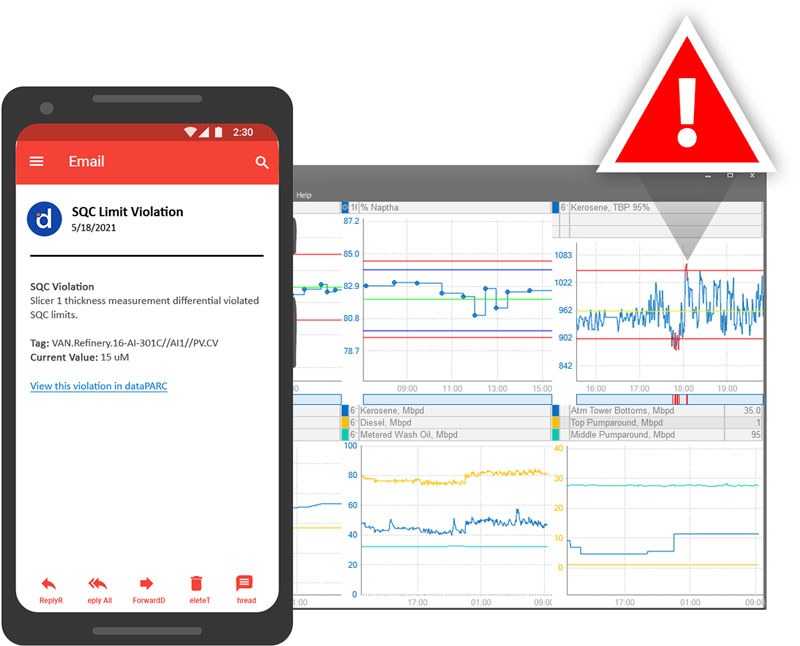
Respond Quickly to Process Issues
Configure smart alarms for real-time production monitoring systems and of manufacturing processes. Automatically notify operators or maintenance personnel about shifts in operating conditions, enabling swift responses. This approach effectively minimizes production losses, enhances productivity, and proactively addresses changes to reduce downtime and waste.
- Send notifications instantly, via email or SMS text.
- Record & forward event details in logbook database.
- Escalate notifications to senior staff automatically if issues are ignored.
- Detect compliance events, including data loss.
- Apply deadbanding to ignore planned downtime events.
- Access event data via dataPARC trends, Pareto charts, & more.
Share Production Performance KPIs
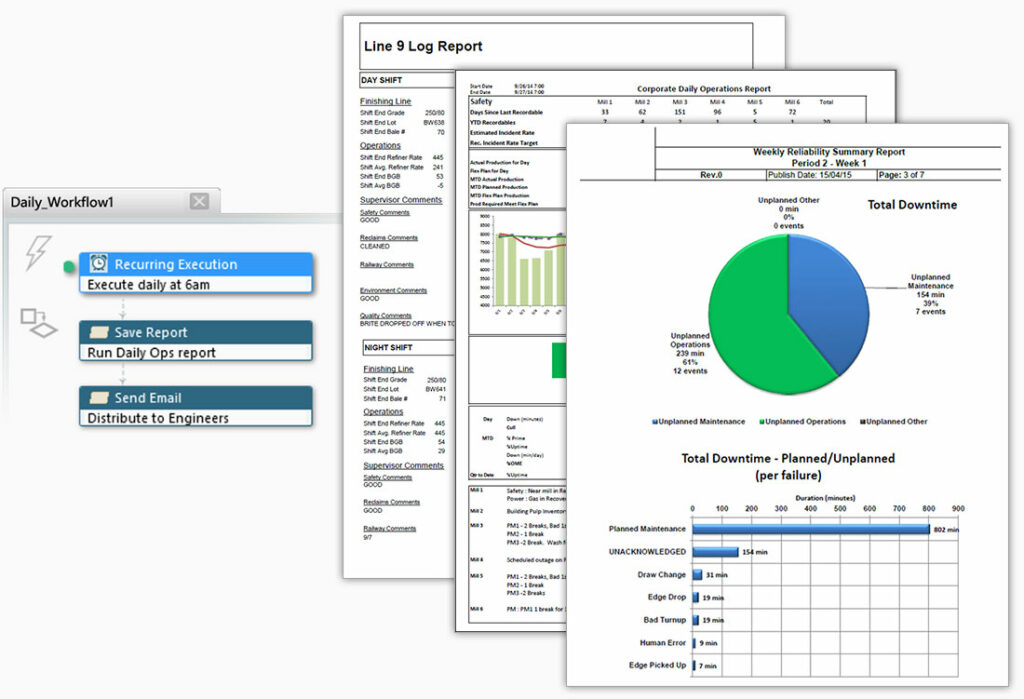
Deliver data-driven insights ahead of the morning meeting through a custom report. Build reports that autonomously fill with your critical production KPIs. Schedule these reports to run, save, and email to a group before your morning meeting. Alternatively, print them on demand for engineers and managers to receive during key plant trials or while on call.
- Report hourly or daily production averages.
- Monitor status of resources like fuel & water.
- Highlight unplanned maintenance & downtime.
- Trigger reports when operating conditions change.
- Visualize data in charts, trends, tables, & more.
Featured Case Study
Kapstone Paper
The global containerboard market is highly competitive, making process optimization essential to a paper mill’s survival. KapStone’s technical team turned to dataPARC to help them centerline their process, identify golden runs, and reduce costs.
Powering Practical Analytics Solutions for 25+ Years
Instead of having only lab people using the lab database and only engineering and operations managers using the process information, it’s all come together. It’s all available to operations, engineering, & managers.

Ryan Sullivan
Production Engineer, W.R. Grace
I look at dataPARC as the first step in the whole data collection journey for our company. If we’re going to become a data-driven company, we have to have easy access to our data. That’s the first step, and that’s what dataPARC has given us.

Derek Peine
General Manager, Western Plains Energy
We were trying to optimize production efficiency at the largest facility in our company and dataPARC allowed us to overlay data – both lab and process – to break down perceptive barriers and make data-driven decisions.

Stan Case
Plant Manager, Amalgamated Sugar
The World’s Largest Manufacturers Depend on dataPARC
Related Solutions
Tackle common manufacturing challenges with PARCview’s out-of-the box functionality.
Quality Control
Real-time, quality monitoring and control tools for continuous or batch manufacturing processes.
Additional Features
dataPARC is a flexible industrial analytics toolkit built upon the promise of easy data acquisition & integration. dataPARC’s core building blocks can be used to build any applications to meet your own industry needs.
Dynamic Alarms & Notifications
Use dataPARC’s rule-based alarm engine to build smart alarm definitions that reliably detect compliance events, including data loss, real time, and aggregate exceedance of regulation limits. Forward alarm event data to PARCview’s Logbook, and send notifications via email or SMS.
Custom Report Builder
PARCview’s highly configurable scripting and scheduling application can schedule and deliver recurring reports or other key data to management and other decision-makers. Create event-triggered reports, dashboard report delivery, & scheduled reports.
Excel Add-In
Designed to automate common or tedious Excel tasks and make it easy to build reusable reports, PARCxla enables users to spend more time making important decisions and less time wrestling with data.
Manual Data Entry
PARCgraphics Designer’s form-based MDE tools offer a platform for constructing custom data entry screens. Enter data against a record from anywhere within the dataPARC environment, across multiple MDE pages, PCs, and locations.
Batch Analysis Tools
Arrange multiple batches by product into a comparison or consecutive view. Search for historical batches based on identifying information, such as batch ID or product label. Determine variability at any point in the batch using Run Trend analysis.
Control Charts
Build control charts (x-bar, range, standard deviation, etc.) from existing sources or PARCview formulas. Define simple min/max limits, choose from Western Electric Rules or custom logic. Limits can be managed natively in dataPARC or imported from a 3rd party database.
Want to Learn More?
Download the datasheet to learn more about how you can improve efficiency with dataPARC’s real time production monitoring solution.