SQC / SPC Software
Higher-Quality. Lower Cost.
Collect & analyze product quality data in real-time. dataPARC’s statistical process control tools allow you to identify issues and process variations before they occur, minimizing scrap or out-of-spec product and increasing First Pass Quality (FPQ).
Connect Lab & Process Data
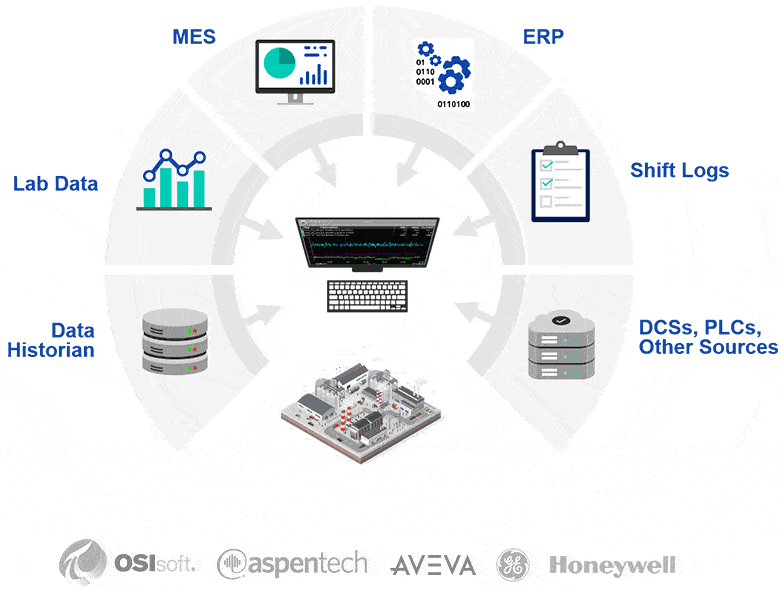
PARCview provides a single source of truth for all your manufacturing data. Aggregate disparate data from machines and manufacturing systems such as ERP, MES, lab, & quality systems, to maintain consistency and reduce cost of poor quality.
- Integrate data from any source. Really.
- Aggregate data from facilities across the globe.
- Combine disparate data into a single trend, dashboard, or report.
- Connect via XML, SQL, Web Services, OPCHDA, & more.
- Leverage existing historians: OSIsoft PI, IP.21, Honeywell, GE, Aveva, etc.
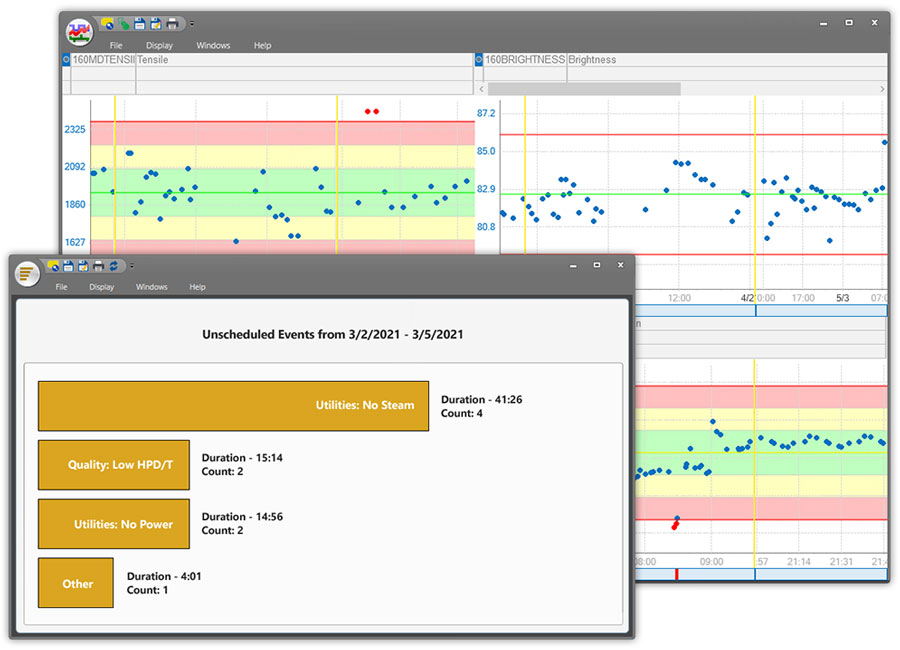
Build Control Charts for SPC Analysis
Apply dataPARC’s SPC/SQC analysis to tags from any data source available (Historian, LIMS, MES, etc.). Build control charts from existing sources or calculated values from PARCview formulas.
- Assign reasons to SQC violations & use Pareto to determine primary culprits.
- Establish limits based on Western Electric Rules or custom definitions.
- Cross correlate variables to identify statistical correlation.
- Identify sources of variation & create new limits after process is improved.
- Create limits based on product or grade runs.
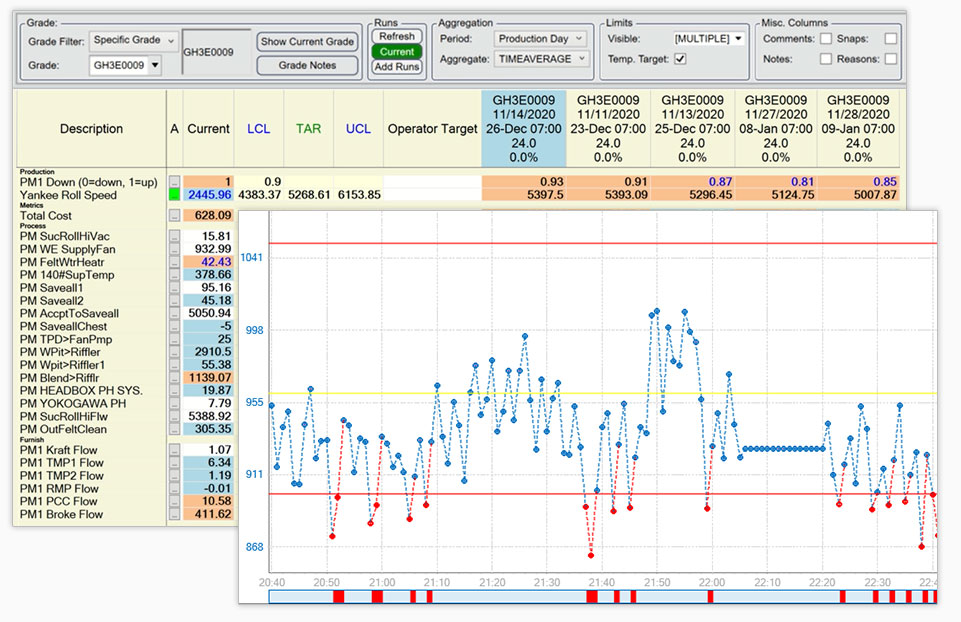
Enable Proactive Plant-Floor Decision-Making
dataPARC’s centerlining application allows operators and engineers to closely monitor critical processes and make proactive decisions to reduce variability and ensure consistent product quality.
“dataPARC has given us the ability to make decisions based on events as they occur, and in some cases, even forecast into the future.”
Steve West, Senior Process Engineer – Catalyst Paper
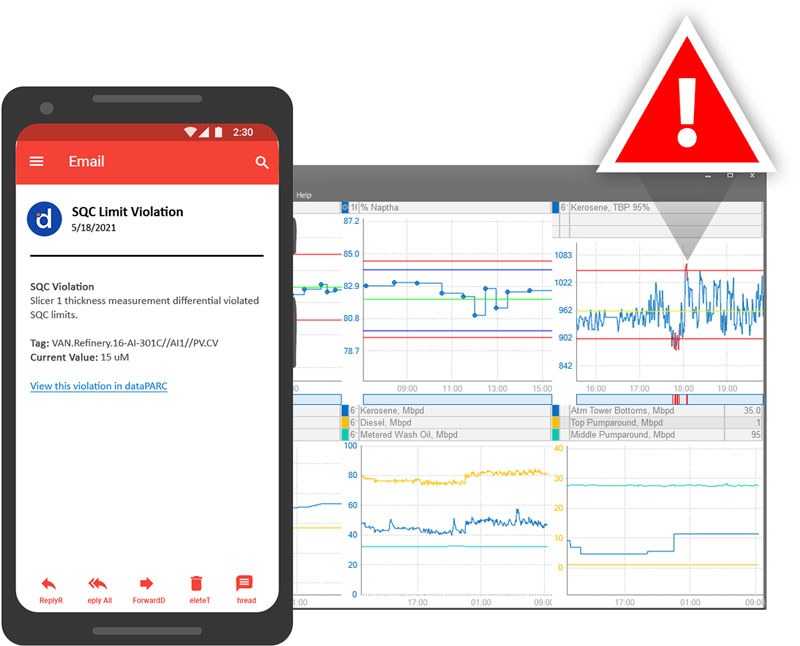
React Quickly to Potential Quality Issues
Configure custom alarms to monitor processes in real-time. Automatically alert operators or engineers to changes in operating conditions, allowing them to respond quickly and reduce scrap or out-of-spec product.
- Send alarm notifications instantly, via email or SMS text.
- Detect process deviations before they affect quality.
- Record & forward alarm event details in logbook database.
- Detect compliance events, including data loss.
- Access alarm data from dataPARC trends, pareto charts, & more.
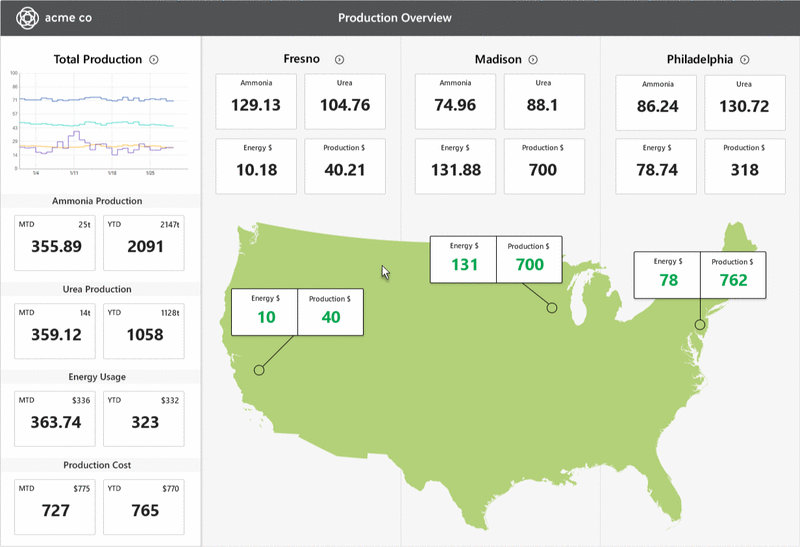
Monitor Quality Metrics in Real-Time
Give operators, engineers, & management insight into current operating conditions. Build real-time dashboards & displays to monitor equipment status, site-level process flows, or enterprise-wide production KPIs.
- Configure custom displays that represent your process.
- Display data from any source (or site) in one view.
- Access dashboards remotely, from any mobile device.
- Design displays using 5000+ pre-built graphic objects.
- Import existing graphics from PI, IP.21, & more.
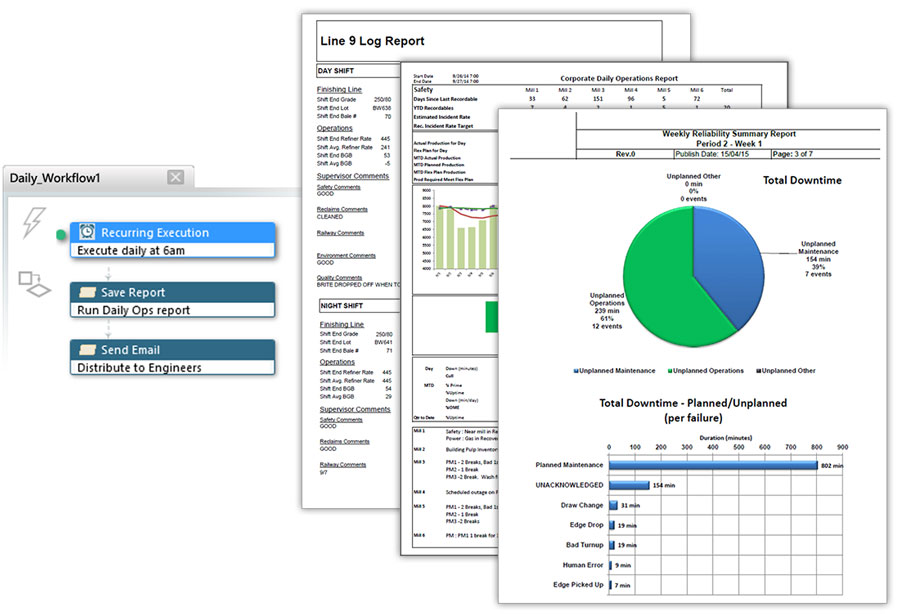
Deliver Quality KPI Reports
Build custom reports that automatically populate with your most important quality KPIs. Schedule reports to run ahead of your morning meeting, or print them on demand for engineers & managers to have delivered while on call or during key plant trials.
- Report custom quality KPIs.
- Monitor Cost of Poor Quality (COPQ) & First Pass Quality (FPQ).
- Highlight unplanned maintenance & downtime.
- Trigger reports to run when operating conditions change.
- Schedule reports to be delivered via email.
Featured Case Study
Kapstone Paper
The global containerboard market is highly competitive, making process optimization essential to a paper mill’s survival. KapStone’s technical team turned to dataPARC to help them centerline their process, identify golden runs, and reduce costs.
Powering Practical Analytics Solutions for 25+ Years
dataPARC is improving the quality of our product, it’s increasing the ability for our processes to run more efficiently, and it’s keeping our employees engaged with the process.

Ryan Sullivan
Production Engineer, W.R. Grace
We were trying to optimize the largest facility in our company and PARCview allowed us to overlay data – both lab and process – to break down perceptive barriers and make data-driven decisions.

Stan Case
Plant Manager – Amalgamated Sugar
We make a lot of different different grades of paper. In order to maximize the dollars for each run, we use dataPARC’s centerline tool to find ‘golden runs’ and those become our target each time we run a grade.

Pami Singh
Director Process Optimization
The World’s Largest Manufacturers Depend on dataPARC
Related Solutions
Tackle common manufacturing challenges with PARCview’s out-of-the box functionality.
Data Integration
Establish a single source of truth for all your manufacturing data. Historian, ERP, MES, lab, & more.
Additional Features
dataPARC is a flexible industrial analytics toolkit built upon the promise of easy data acquisition & integration. dataPARC’s core building blocks can be used to build any applications to meet your needs.
Real-Time Trending
Widely considered the best process trending application available, PARCview provides a combination of powerful features and ease of use to help troubleshoot and analyze data. drag & drop, dragging time-axis, time syncing of multi-trends, multi-trend templates.
Dashboards & HMI Displays
Create high-performance HMIs and enterprise dashboards to display your data. Create animated displays by associating object properties (size, color, background, foreground) with tag values. import existing dashboard graphics from PI, IP.21, and more.
Advanced Modeling Tools
The PARCmodel component of dataPARC’s product group predicts plant quality variables in real-time, allowing for estimation of properties that are impractical or impossible to measure online.
Grade Troubleshooting
PARCview’s Run Browser engine smartly determines when a grade or product was produced, and then loads those time periods in Trends or Chart displays. Filter grade runs by date or duration, and normalize data as needed. View runs consecutively over time, or overlayed and color-coded for comparison.
Batch Analysis Tools
Arrange multiple batches by product into a comparison or consecutive view. Search for historical batches based on identifying information, such as batch ID or product label. Determine variability at any point in the batch using Run Trend analysis.
Control Charts
Build control charts (x-bar, range, standard deviation, etc.) from existing sources or PARCview formulas. Define simple min/max limits, choose from Western Electric Rules or custom logic. Limits can be managed natively in dataPARC or imported from a 3rd party database.
Want to Learn More?
Download the datasheet to learn more about how you can improve efficiency with dataPARC’s real time production monitoring solution.