Most industrial analytics platforms are powerful, but they’re powerful for one type of user. Engineer-first tools dominate the space, leaving operators and management to either work around the technology or work without the data altogether. The result is information asymmetry: insights stuck on analysts’ laptops, dashboards bolted on as afterthoughts, and decisions made in the dark. This article unpacks who industrial analytics tools are really built for, why that matters more than vendors like to admit, and what it looks like when a platform is designed to serve every level of the organization.
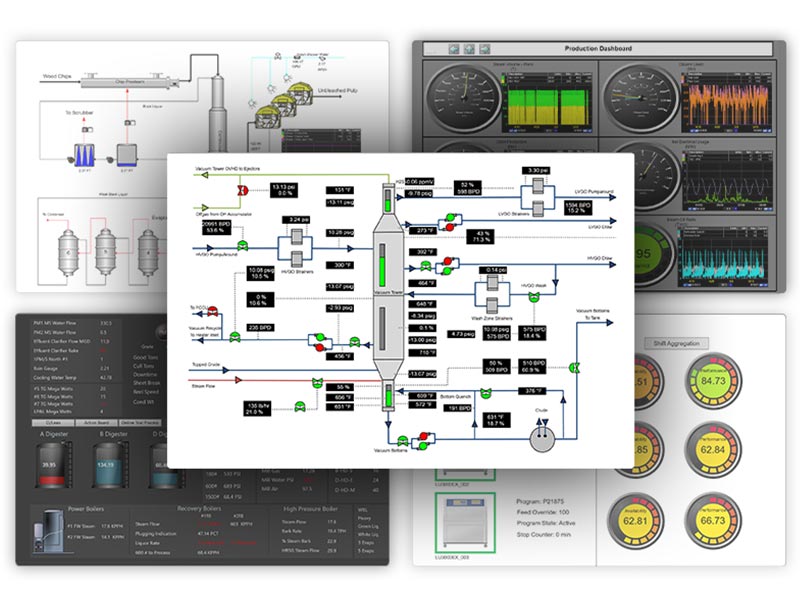
Build Real-Time Dashboards & Displays for Every Level of Operation
If you’ve ever tried to roll out a data analytics platform across your organization and watched half your team struggle to use it, you’ve already experienced this problem firsthand.
The industrial data analytics space is full of powerful tools. But powerful for whom? Dig beneath the surface of most platforms, and a clear bias emerges: the tool was built with one type of user in mind. And everyone else is left to figure it out on their own.
This isn’t a minor inconvenience. It’s the core reason so many analytics initiatives fail to deliver on their promise. Data gets siloed. Insights don’t reach the people who need to act on them. And the gap between those who understand the data and those who make decisions keeps widening.
So let’s answer the question directly: who are data analytics tools really built for, and what does it look like when a platform is built for everyone?
The Engineer-First Problem
Many industrial analytics tools are, at their core, built for engineers and data scientists. That’s not necessarily a criticism. These users have complex, technical needs. They need to build models, query large datasets, configure data pipelines, and perform deep analysis. Tools like Seeq are well-regarded in this space precisely because they serve that audience well.
But here’s what “engineer-first” actually means in practice:
- Steep learning curves that require formal training or a data science background
- Interfaces that assume familiarity with scripting, tagging, or SQL-style logic
- Outputs designed for technical review, not operational decision-making
- Insights that live in the analyst’s laptop, not on the plant floor
When an analytics tool is designed this way, the insights it produces are only as useful as the engineer’s ability to translate and distribute them, often manually, on their own schedule, to whoever asks. That’s a bottleneck, and it costs organizations more than they realize.
The best data analytics platform isn’t the one with the most powerful algorithms. It’s the one your operator, engineer, and plant manager can all use to make decisions, on the same data, at the same time.
What Operators Actually Need
Operators are the people closest to the process. They’re monitoring equipment in real time, responding to alarms, and making dozens of small decisions every shift that collectively determine whether a plant runs efficiently or not.
What they need from analytics is speed and clarity. Not a Python notebook. They need to look at a screen, understand what’s happening right now, and know what to do about it. Give them that, and you unlock an enormous amount of operational intelligence that currently exists only in their heads.
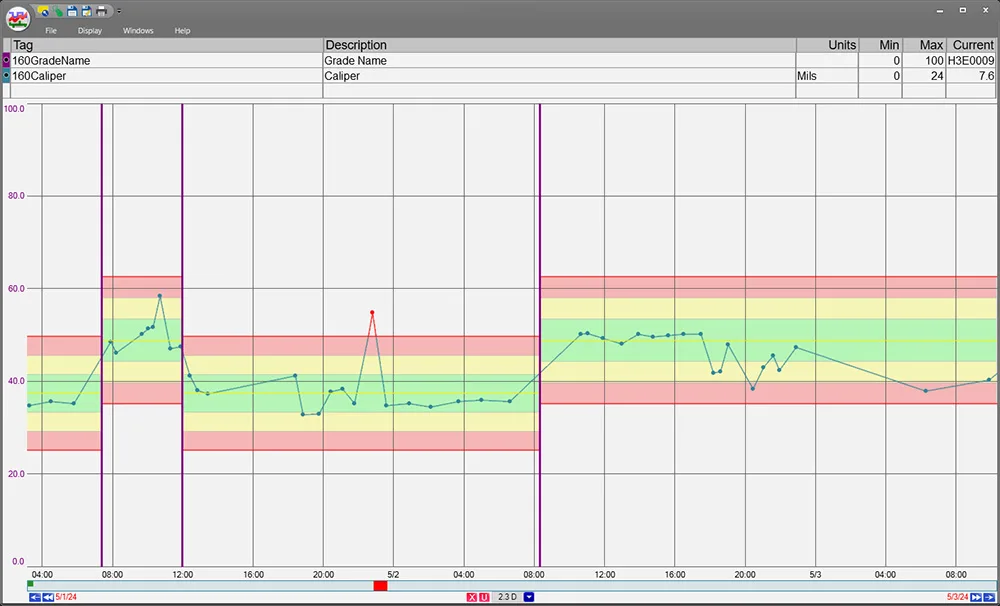
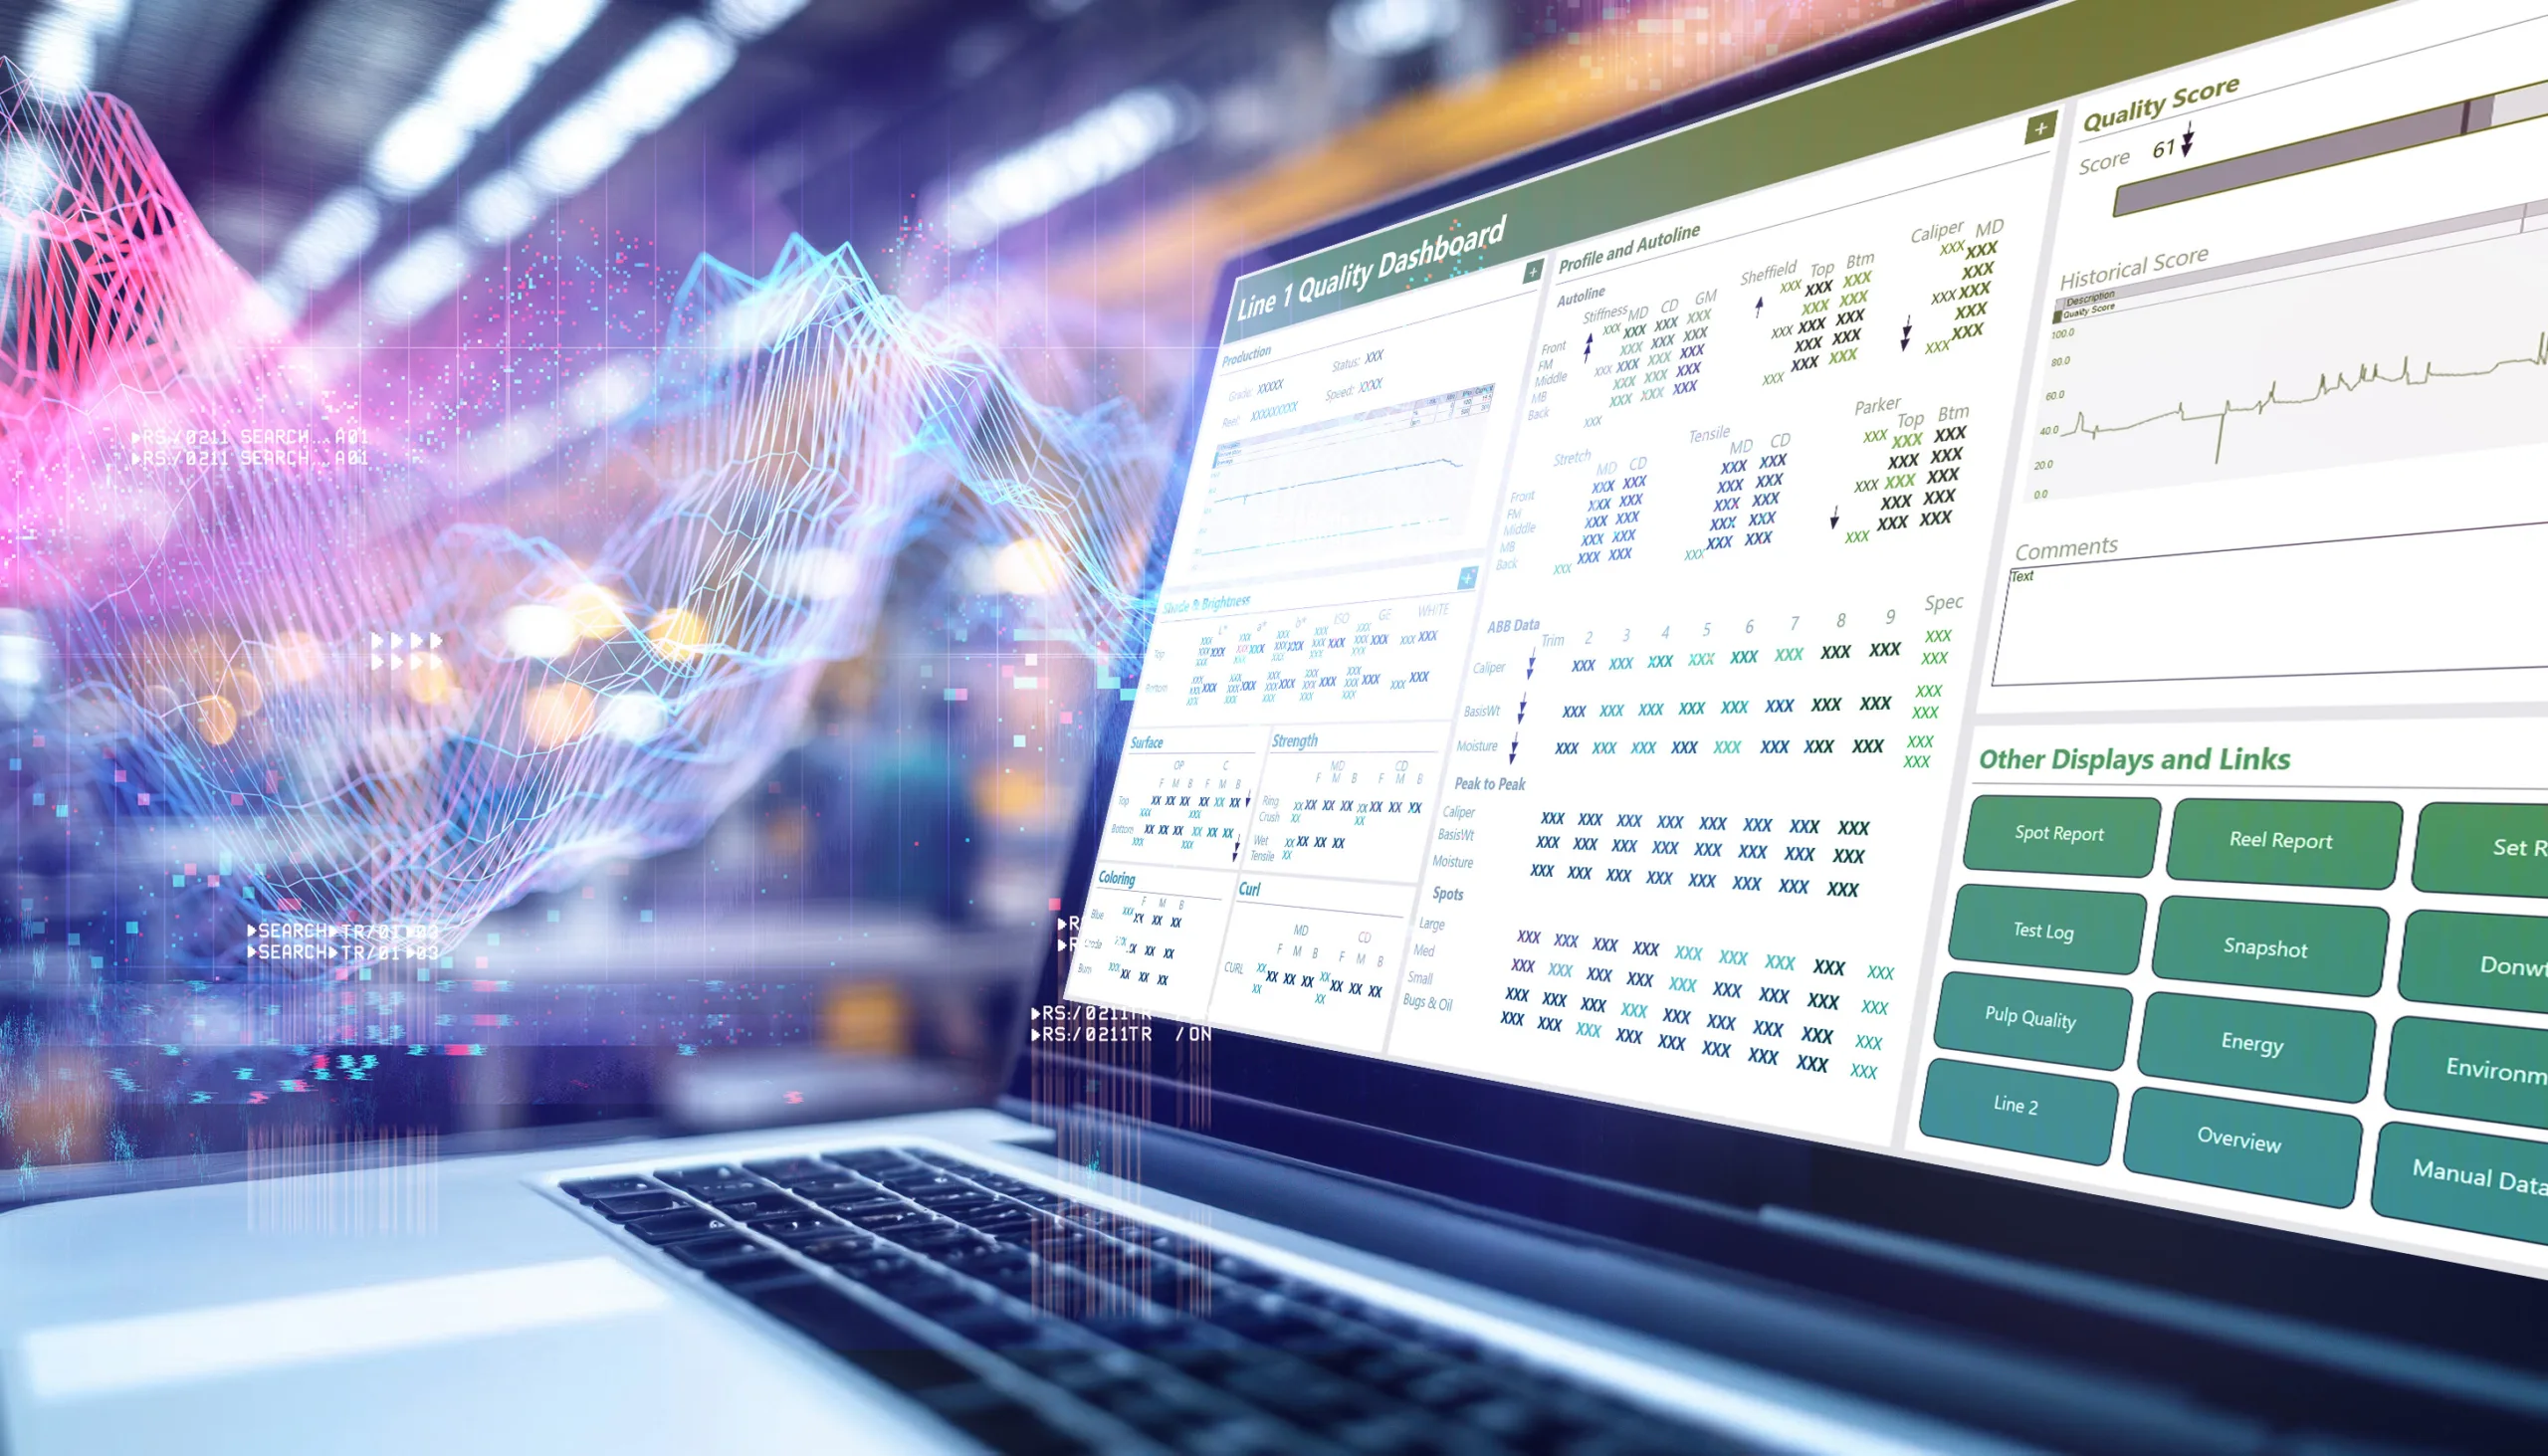
Operators can quickly see how data is trending and if it is within the operating specifications. As the grade changes, the limits change.
Most engineer-first tools don’t serve this user at all. The interface is too complex, the outputs too technical, and the onboarding too steep. The result: operators work from experience and instinct rather than data, not because they don’t want data, but because the data was never made accessible to them.
And Management? They’re Underserved Too.
On the other end of the spectrum, plant managers, operations directors, and executives need a very different view of the data. They’re not interested in individual tag values, they need KPI dashboards, trend summaries, and the ability to compare performance across lines, shifts, or sites.
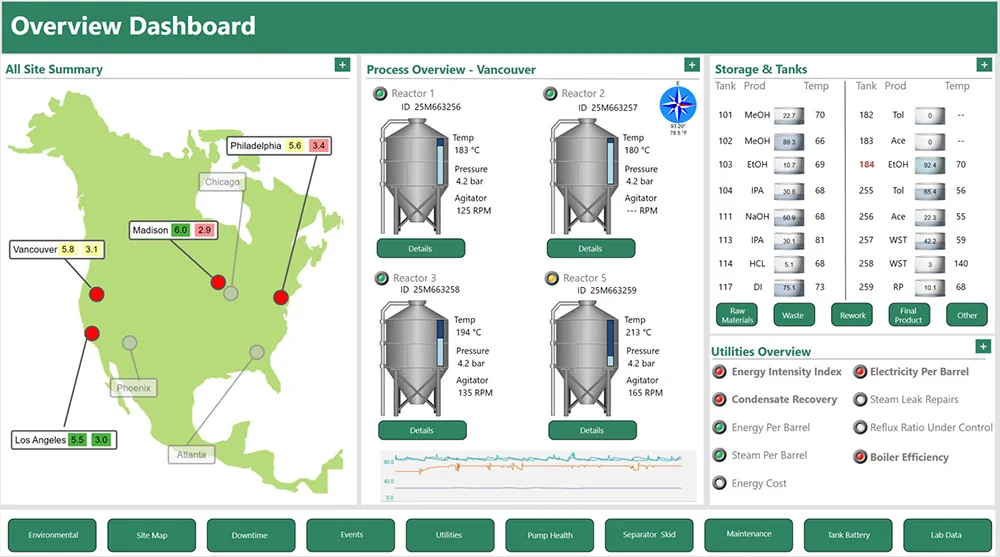
An overview dashboard is a great view for management to quickly see how the entire process is running.
Many analytics tools bolt on a reporting layer as an afterthought. The result is management dashboards that are disconnected from the live operational data, updated manually, or require a dedicated analyst to maintain them. None of this scales.
The Tool Hierarchy: How Most Platforms Stack Up
Let’s compare two tools, Seeq and dataPARC. Seeq is more of an engineering-first product. It has powerful analytics and modeling tools for technical users. It is great at deep process investigation and advanced data science workflows. The issue arises when operators or management try to use the tool for daily analytics. Some find it is a complex tool with a steep learning curve.
dataPARC was built with a foundational belief that data should flow to every level of an organization, not just to those technical enough to retrieve it themselves. That philosophy shapes everything about how the platform is designed.
For operators, dataPARC provides intuitive real-time visualizations and configurable displays that require no technical background to use. An operator can monitor critical process variables, identify deviations, and respond to issues without ever leaving their interface or waiting for an engineer to pull a report.
For engineers, the platform delivers the depth and flexibility they need, detailed trend analysis, multi-variable charting, calculations, and access to the full historical dataset. Nothing is taken away from the technical user in order to make the tool accessible to others.
For management, dataPARC surfaces the KPIs and performance metrics that matter at a strategic level. Live dashboards replace static reports. Shift-over-shift and line-over-line comparisons are built in. The right information reaches the right person without anyone having to manually compile it.
This is what it means to bridge the gap, not simplifying a tool until it’s useless to experts, but designing one that meets every user where they are.
Why Data Access Matters
As industrial organizations push toward digital transformation and real-time operational excellence, the analytics tools they choose will either accelerate that vision or quietly undermine it. A platform that only serves one tier of the organization creates information asymmetry. Some people have access to data, and others are making decisions in the dark.
The organizations seeing the most measurable ROI from their analytics investments share a common trait: their data is democratized. Operators, engineers, and managers are all working from the same source of truth, in interfaces built for their specific needs.
That’s not a coincidence. That’s what the right platform makes possible.
Mastering Manufacturing Metrics
The Ultimate Guide to Establishing, Measuring, & Reporting KPIs for Peak Plant Performance