In this blog, we’ll look at why users are seeking Trident Replacements. As well as where Trident Workbench starts to hit its limits, what to look for in a replacement, and where a unified platform like dataPARC fits into the picture.
Check out dataPARC’s real-time process data analytics tools & see how better data can lead to better decisions.
If you’re running Trident Automation’s Workbench Suite and starting to feel like you’ve outgrown it, you’re not alone. Trident has served the ethanol industry well for years. Their Workbench modules pull together lab data, KPIs, and dashboards for plants that needed straightforward reporting. But as manufacturing operations grow, diversify, or push into more sophisticated analytics, teams often start bumping into the ceiling of what a modular reporting suite can do.
This piece is for engineers and plant leaders who have run into roadblocks. The ones who’ve gotten real value out of Trident but are starting to ask what a more complete data platform would look like. We’ll walk through why teams outgrow Trident, what to look for in a replacement, and where dataPARC fits for organizations ready for a more unified analytics stack.
Why Teams Outgrow Trident Workbench
Trident Workbench was built around a modular philosophy: a Lab & Data Collection module, a KPI module, a Dashboard module, a Reports Engine, and a Mobile module. Each piece does its job, and for plants with narrow reporting needs, especially ethanol producers. It’s a reasonable fit. But that modular design starts to show its limits in a few predictable ways.
You’re past reporting and into analysis.
Workbench is fundamentally a data-collection-and-reporting tool. It surfaces what happened. But then you advance, and the team starts asking why. Why yields dropped last Tuesday, why one shift consistently outperforms another, why the same failure keeps showing up? Then it is time for multi-variable trending, comparative analysis, and the ability to interrogate years of history at speed. That’s a different tool category.
You’re expanding beyond ethanol.
Trident’s roots are in biofuels, and much of their product portfolio reflects that. If your operation is diversifying, adding lines, or spans multiple industries, a platform built industry-agnostic will scale more cleanly than one shaped around one process.
You’re managing too many modules.
Modular architectures are appealing on paper, only pay for what you need. In practice, each module has its own quirks, its own upgrade cycle, its own integration points. Teams eventually spend more time keeping the pieces stitched together than they spend on the actual work. There are other tools out there where you get all the tools, so you can test out what you need and ignore the pieces you don’t.
You want engineering-grade trending, not just dashboards.
Dashboards are great for management summaries. But engineers investigating a process issue need to overlay dozens of tags, zoom into millisecond-resolution windows, and export data for further analysis. That’s a workflow most reporting suites aren’t designed for.
Your historian is separate from your reporting layer.
Trident Workbench sits on top of whatever historian you already have. That works, but it also means you’re managing two contracts, two roadmaps, and two vendors for what could be one tightly integrated stack.
The point isn’t that Trident is a bad tool. The point is that reporting suites and full analytics platforms solve different problems, and if you’re running into the second one, no amount of module-shuffling will fix it.
What To Look For In A Trident Replacement
If you’ve decided it’s time to look at alternatives, here’s what actually matters. These are the criteria that separate a modular reporting stack from a platform built to grow with you.
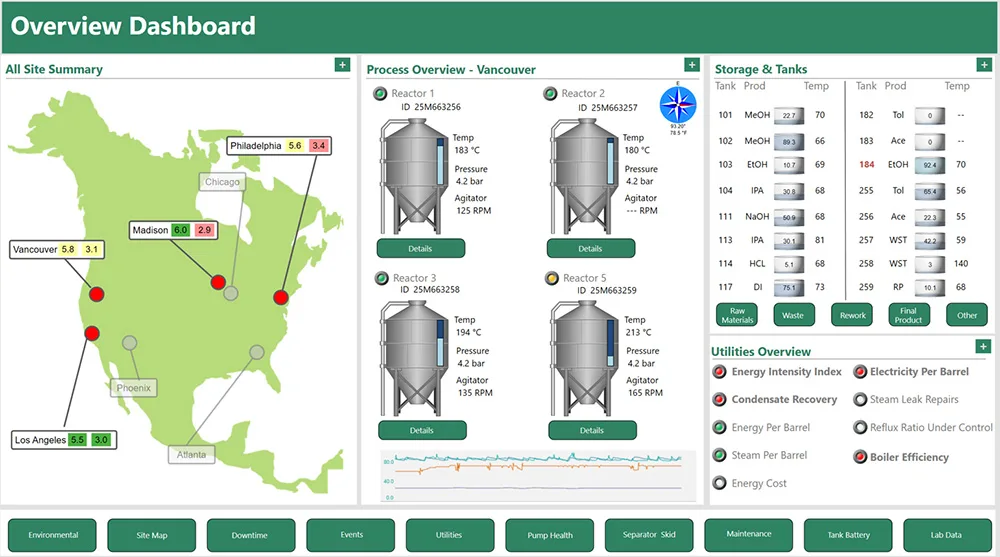
With dataPARC, dashboards can be customized with embedded trends and tag values. These values are clickable to quickly see that data in a trend rather than a single value.
- Integrated historian and analytics. One platform that collects, stores, and analyzes. Not three tools pushed together. This dramatically shortens the path from “I have a question” to “I have an answer.”
- Real trending, not just charting. Multi-tag overlays, calculated variables, high-resolution zoom, statistical process control, and side-by-side comparisons across time periods, shifts, or lines.
- Interfaces built for every user. Operators need real-time visibility and clarity. Engineers need depth and flexibility. Management needs KPIs and trend summaries. A replacement that only nails one of those tiers is a lateral move.
- Predictable, sustainable pricing. Per-user fees punish you for getting data into the hands of your employees. Look for platforms with pricing models that scale sensibly as your data footprint grows.
- A migration path that respects what you already have. You have years of historical data, existing dashboards your team knows how to read, and reports that go to specific people at specific times. A good replacement vendor helps you preserve that continuity, not force a start-from-scratch.
- Industry-agnostic architecture. Even if you’re in ethanol today, the tool should work equally well in pulp and paper, food and beverage, chemicals, oil and gas, or any other continuous or batch process. That flexibility future-proofs you.
Thinking about an Industrial Data Platform? Let our Smart Factory guide your way.
Where dataPARC Fits
dataPARC is a full manufacturing analytics platform. It has a historian, trending, visualization, KPI tracking, and reporting. All designed around the workflows of engineers, operators, and management alike. Here’s a closer look:
One platform, not a stack of modules.
While dataPARC does have two main products: The Historian and PARCview, PARCview itself is a single platform with all the analytics and visualization needed. It can sit on top of a historian, and it has the analytics engine, the visualization layer, and the reporting tools in a unified product. You’re not stitching pieces together or paying separately for each function.
Trending built for engineers who actually investigate.
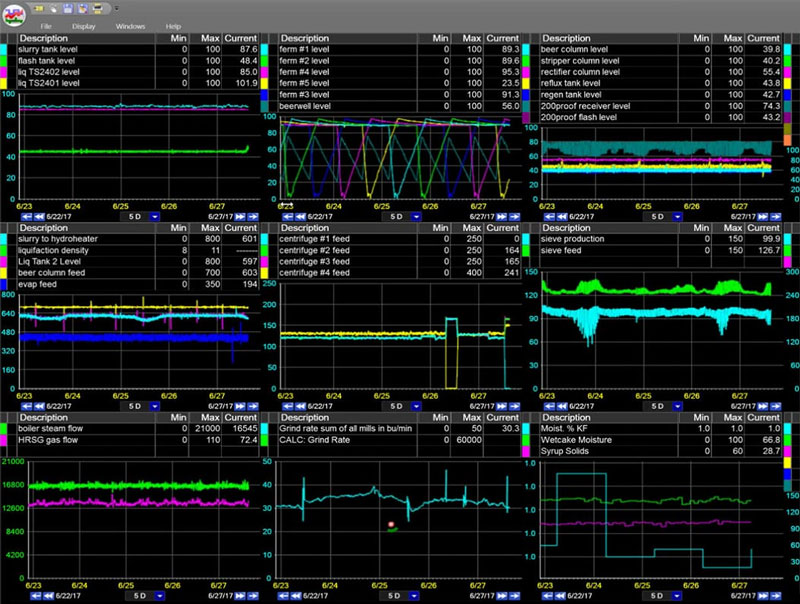
PARCview gives you multi-tag trending, calculated variables, statistical tools, and the ability to overlay years of history in seconds. It’s the workflow engineers reach for when they need to figure out what actually happened, not just report on it.
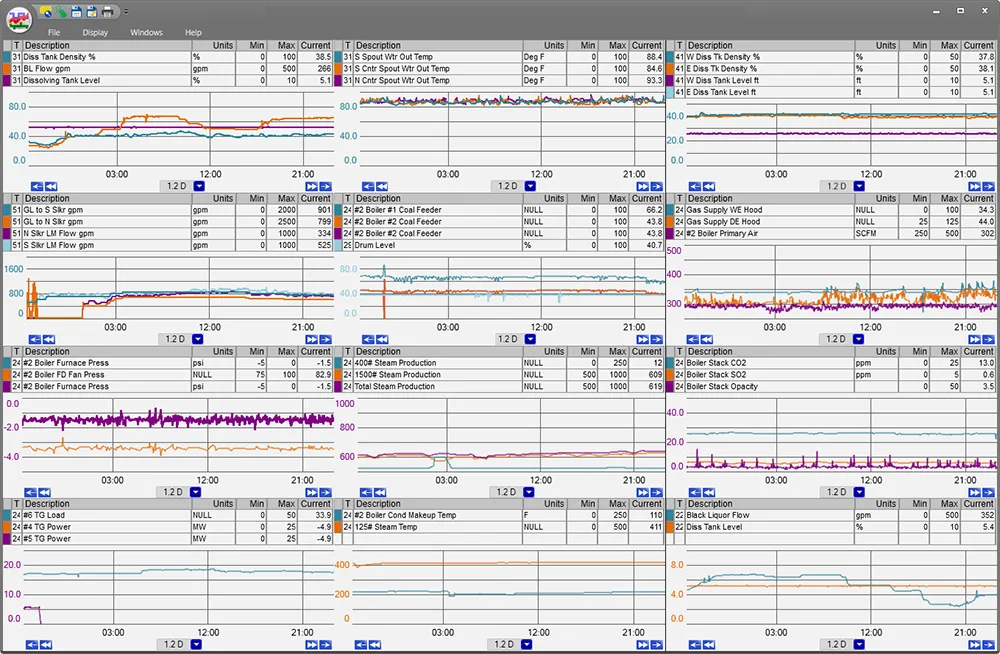
Multi-trends allow users to see a lot of data at once; they can quickly spot changes over time or identify when values goes into alarm.
Real-time dashboards for the plant floor.
Operators get intuitive, configurable displays that surface what matters right now. Deviations, KPIs, alarms, and live process values are available without needing an engineer to build them a report.
KPI tracking and executive views without the bolt-on.
Management dashboards pull from the same live data everyone else is looking at. No manual compilation, no static reports, no “last month’s numbers” problem.
Perpetual licensing option.
For teams that plan to use the software for the long haul, dataPARC offers a perpetual licensing option that typically comes in well below the total cost of ownership of a subscription over 5 to 10 years.
Still a place to enter lab data
If you’re using Trident for lab data, and are concerned about how that will look with any future software, dataPARC includes a Manual Data Entry option. Sites can create their own tags and create custom entry screens for inputting data.
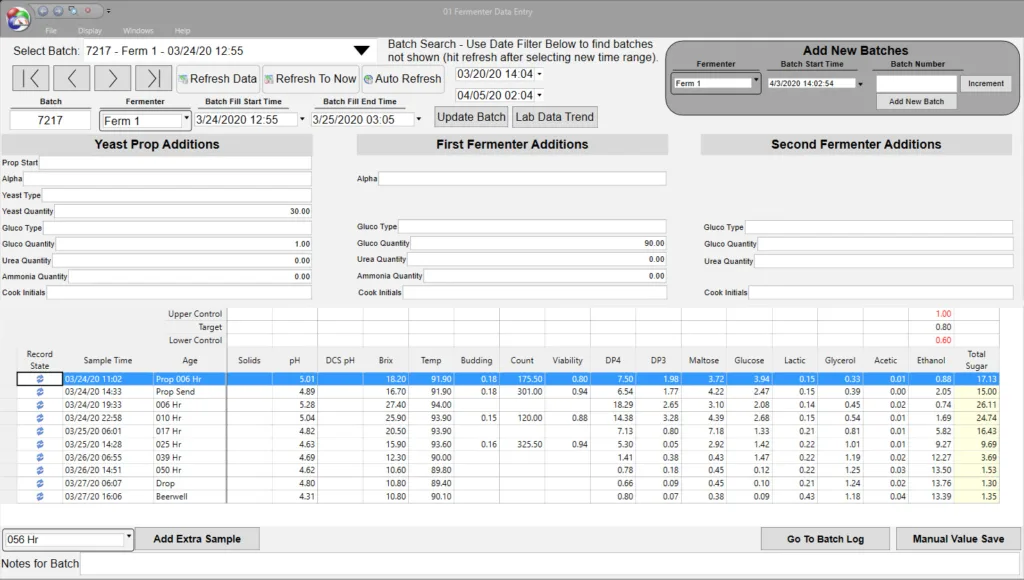
This data entry dashboard was customized for an ethanol plant. Data is entered and it can be trended along side the process data since it is all in one place.
Industry-agnostic by design.
dataPARC customers run pulp and paper mills, chemical plants, food and beverage operations, ethanol facilities, and everything in between. The platform doesn’t assume you’re running a fermentation process.
Questions to ask before you switch
If you’re evaluating a Trident Workbench replacement, run through this short list of questions:
- Can operators, engineers, and management all use it, or will we still need a separate tool for two of those three audiences?
- How does pricing scale as we add tags, users, or sites?
- What’s the migration story for our existing dashboards, reports, and historical data?
- Does the trending tool actually let engineers investigate root causes, or is it primarily a charting layer for dashboards?
The Bottom Line for A Trident Replacement
Those looking for a Trident Replacement are looking to get more out of their software. If that job has changed for your organization, the answer isn’t to add more modules or work harder to make it fit. It’s to look for a platform that meets you where you are now and where you’re headed.
If you’d like to see what a unified analytics platform looks like in practice, reach out for a demo.
Building The Smart Factory
A Guide to Technology and Software in Manufacturing for a Data-Drive Plant