Reducing operating costs doesn’t always mean changing how the factory runs, sometimes it starts with taking a hard look at the tools and subscriptions already on the books. Your analytics platform is one of those line items worth revisiting. Whether your current solution has gotten too expensive, too complex, or just isn’t keeping up with what your team needs, there are strong alternatives worth knowing about. In this blog we’ll walk through what to look for when evaluating a Siemens XHQ alternative and how to make sure you’re choosing a platform that actually fits your operation.
Check out dataPARC’s real-time process data analytics tools & see how better data can lead to better decisions.
If you’re reading this, there’s a good chance something about your current Siemens XHQ setup isn’t working the way you need it to. Maybe the licensing costs have crept up. Maybe it’s harder to customize than you expected. Maybe your team is spending more time managing the platform than getting value out of it. Whatever the reason, you’re not alone. Manufacturers across a wide range of industries are evaluating their options, and the market for operations intelligence and data visualization tools has never been more competitive.
The good news is that there are strong alternatives out there. The challenge is knowing what to look for so you don’t end up trading one set of frustrations for another. This post walks through the key things to consider when evaluating a Siemens XHQ alternative, so you can make a decision you’ll still feel good about a few years from now.
Why Manufacturers Are Looking For Siemens XHQ Alternatives
There are a few common reasons teams start evaluating XHQ alternatives:
- Cost: XHQ licensing and implementation costs can be significant, especially for mid-sized manufacturers who don’t need every feature the platform offers.
- Complexity: Getting XHQ configured and customized to your specific operation often requires significant professional services time, and ongoing changes can be slow and expensive. However, if you have had XHQ for years, this is less of a concern.
- Flexibility: Some teams are finding it difficult to get data out of XHQ and into other tools. With the increase in requirements to connect or send data to modern third-party data sources or AI applications, this limitation could be holding sites back.
- Overkill for the use case: For many manufacturers, the core need is solid real-time visualization, trending, and KPI tracking. A simpler, more focused tool does that job better and more affordably.
What To Look For In A Siemens XHQ Alternative
You probably already have a short list of items based on how XHQ currently functions that you want to ensure your next product keeps the same functionality or does something better. Here are a few other items to take into consideration when evaluating new systems.
Strong data visualization and dashboarding
This is the core job. Whatever platform you choose should make it easy to build dashboards that show the right information to the right people, operators, engineers, and management, without requiring a developer every time something needs to change. Look for drag-and-drop display building, flexible KPI widgets, and the ability to create role-specific views without a lot of overhead.
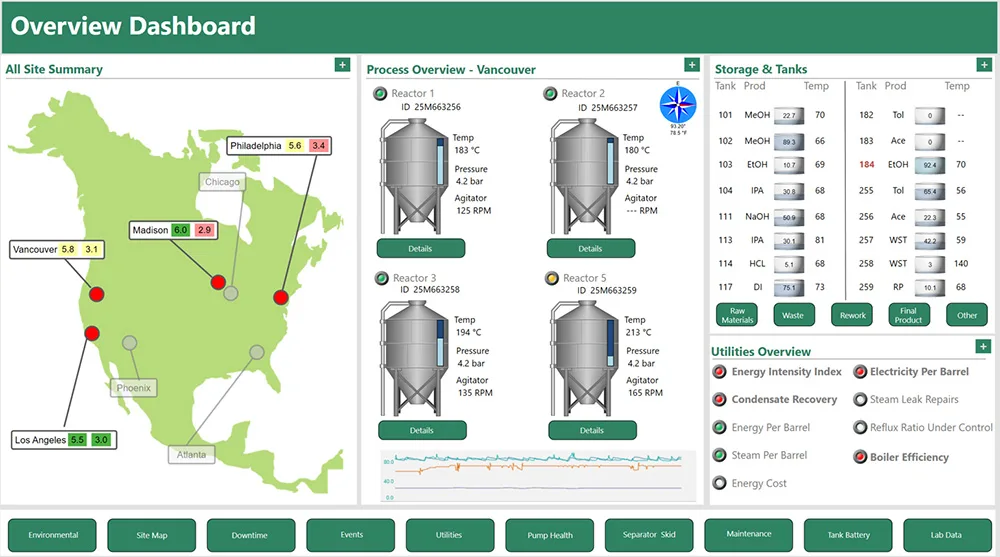
Dashboards are an important part of operating a process, making sure everyone sees the correct information. Having elements that are quick to build help create interactive dashboards.
Deep historian integration
Operations intelligence is only as good as the data feeding it. Make sure any alternative you evaluate integrates cleanly with your historian, whether that’s the dataPARC Historian, OSIsoft PI, or another platform.
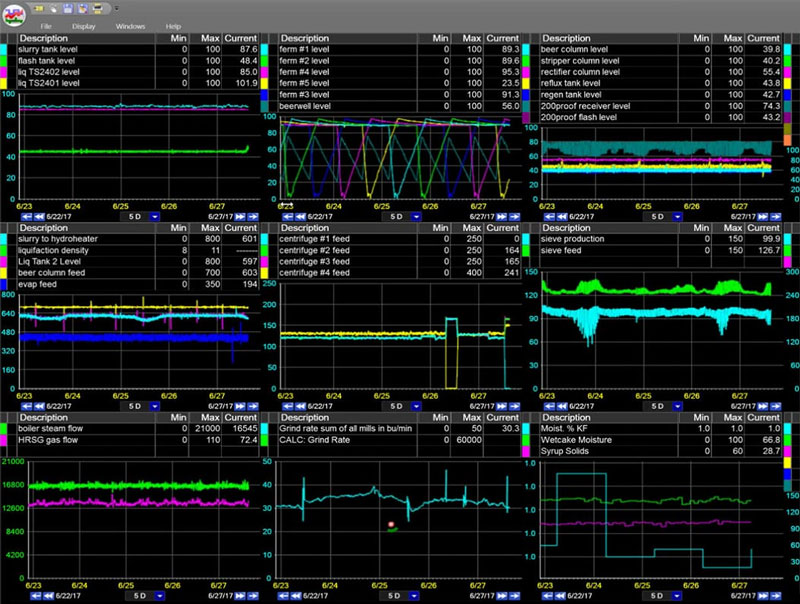
Trending and analysis built in
A good XHQ alternative shouldn’t just show you what’s happening right now. It should make it easy to dig into historical data, compare trends, and do the kind of analysis that helps you understand why something happened and prevent it from happening again. Look for built-in trending, batch analysis tools, and the ability to go from a dashboard to a detailed trend view without switching platforms.
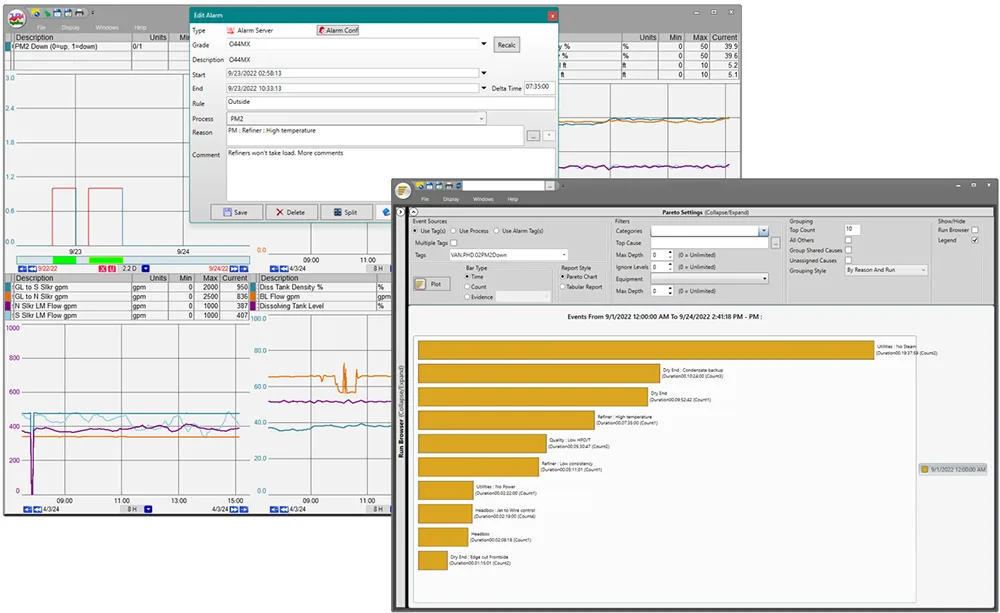
Within a trend, a user can start analysis with XY-plots, histograms and Pareto charts, all without stepping away from their tags.
As a side note here, keep in mind who your main user base is. Is it going to be data scientists or operators? The level of analysis will differ for each, and you want to ensure the tool doesn’t have increased complexity.
Open data access and API flexibility
If AI tools, cloud platforms, or third-party analytics applications are anywhere on your roadmap, make sure the platform you choose can support that. Open API access, flexible data export, and the ability to write external data back into your system are increasingly important as manufacturers look to get more out of their process data.
Scalability without complexity
One of the most common complaints about enterprise platforms like XHQ is that they’re built for the largest possible deployment, which means smaller or mid-sized operations end up paying for and managing complexity they don’t need. Look for a platform that scales with you rather than one that assumes you’re already at enterprise scale from day one.
Total cost of ownership
Licensing cost is just one piece of the puzzle. Factor in implementation time, customization costs, ongoing maintenance, and the internal resources required to keep the platform running. A tool with a lower license cost but a long, expensive implementation may not be the bargain it appears to be, and vice versa. Also consider models that are perpetual versus a subscription-based model. When will the cost even out? Do you want to pay that fee forever?
Vendor support
You’re going to be living with this platform for a long time. Make sure the vendor has responsive support and a track record of delivering on what they promise. Talking to existing customers, or reading online reviews, is a great way to get an honest picture of what the support experience actually looks like.
Why dataPARC is Worth A Look
dataPARC’s PARCview platform was built specifically for manufacturing data visualization and analysis. It connects directly to many historains as well as other common data sources, and gives operators and engineers a fast, flexible way to visualize process data, build dashboards, trend tags, and analyze batch and continuous operations.
Connect all your data to one platform, making it easy for users to know what is going on.
Where dataPARC stands out:
- Speed: PARCview is built for performance, with fast rendering even across large tag counts and long time ranges.
- Ease of use: Displays and dashboards can be built and modified by engineers, not just developers, which means changes happen faster and cost less
- Open data access: The dataPARC Historian’s open API makes it straightforward to connect AI tools, cloud platforms, and third-party applications without workarounds
- Data ownership: Your data is yours, in a format you can access and use however you need
Making The Switch: What To Expect
Switching operations intelligence platforms is a significant project, but it doesn’t have to be as painful as it sounds. A few things that make the transition smoother:
- Inventory your existing displays: understand what you have before you start migrating, so you can prioritize what matters most and leave behind what nobody was using anyway. Check to see if your new system has a display migration so you don’t have to recreate past work.
- Involve operators early: the people who use the displays every day have the best insight into what works and what doesn’t, and getting their buy-in early makes adoption much smoother
- Plan for data migration: if you’re also switching historians, make sure historical data migration is part of the project plan from the start
There’s no shortage of options when it comes to operations intelligence and data visualization platforms. The key is being clear about what you actually need, and making sure the platform you choose is built to deliver that without unnecessary complexity or cost.
If you’re in the early stages of evaluating alternatives to Siemens XHQ, dataPARC is worth adding to your list.
Want to see PARCview in action? Request a Demo
FAQ: Siemens XQH Alternatives
- Is dataPARC a direct replacement for Siemens XHQ?
dataPARC’s PARCview platform covers the core use cases most manufacturers rely on XHQ for, real-time dashboards, KPI visualization, trending, and analysis. For operations that need a straightforward, high-performance visualization and analytics layer on top of their historian, PARCview is a strong alternative. - Can dataPARC connect to my existing historian?
Yes. PARCview connects to the dataPARC historian and other common historian platforms. If you’re running OSIsoft PI or another third-party historian, dataPARC can typically connect to it directly. This means you don’t necessarily have to replace your historian and your visualization layer at the same time. - Is dataPARC only for large manufacturers?
No, dataPARC isn’t only for large manufacturers. PARCview and the dataPARC Historian are used by manufacturers ranging from single-site operations to large multi-site enterprises. One of the advantages of dataPARC over platforms like XHQ is that it scales with you; you’re not paying for enterprise complexity you don’t need on day one. - How do I know if dataPARC is the right fit for my operation?
dataPARC offers demos where you can walk through your specific requirements and see how PARCview handles them. That’s a much better basis for a decision than a feature comparison spreadsheet alone.
Building The Smart Factory
A Guide to Technology and Software in Manufacturing for a Data-Drive Plant