Equipment downtime is critical to track because if the process isn’t running, you aren’t producing any product. When collecting and tracking downtime data, there are several keys to ensure you are creating useful information.

Tracking downtime is crucial for any manufacturing operation. It provides insights into equipment performance, helps identify bottlenecks, and enables proactive maintenance planning. Downtime tracking can significantly improve overall equipment effectiveness (OEE), leading to increased productivity and cost savings.
According to a study by Aberdeen Group, companies with best-in-class OEE practices experience 20% less unplanned downtime. By understanding and reducing downtime, manufacturers can enhance operational efficiency, reduce costs, and maintain a competitive edge.
Downtime can be tracked and monitored in a variety of ways, one being equipment downtime and production downtime. Equipment downtime refers to periods when machinery is not operational due to failures, maintenance, or upgrades.
Production downtime encompasses broader issues, including equipment downtime, but also factors like material shortages, labor issues, or process inefficiencies that halt production. Both types of downtime impact overall productivity, but understanding their differences is key to implementing effective solutions to reduce equipment downtime and improve overall plant performance.
Automate Downtime Tracking And Monitoring
It is possible to track downtime manually, but manual data is usually not accurate and it is difficult to use in a timely manner. For example, operators aren’t good time keepers. They are busy trying to resolve the problem and get the machine running, so the total downtime duration is a guess that is often inaccurate. It is easy to think you were down for an hour when maybe it was only half an hour. How many times have you been at work and thought it must be almost lunch time, and when you look at the clock it was only 10 a.m.?
Additionally, manual data can get incorrectly transcribed or lost and it can be difficult to compile accurately. When events go unassigned, it is difficult to know what to work on, but inaccurate machine data can also be even worse. An operator might also document an inaccurate time on purpose to hide excessive downtime.
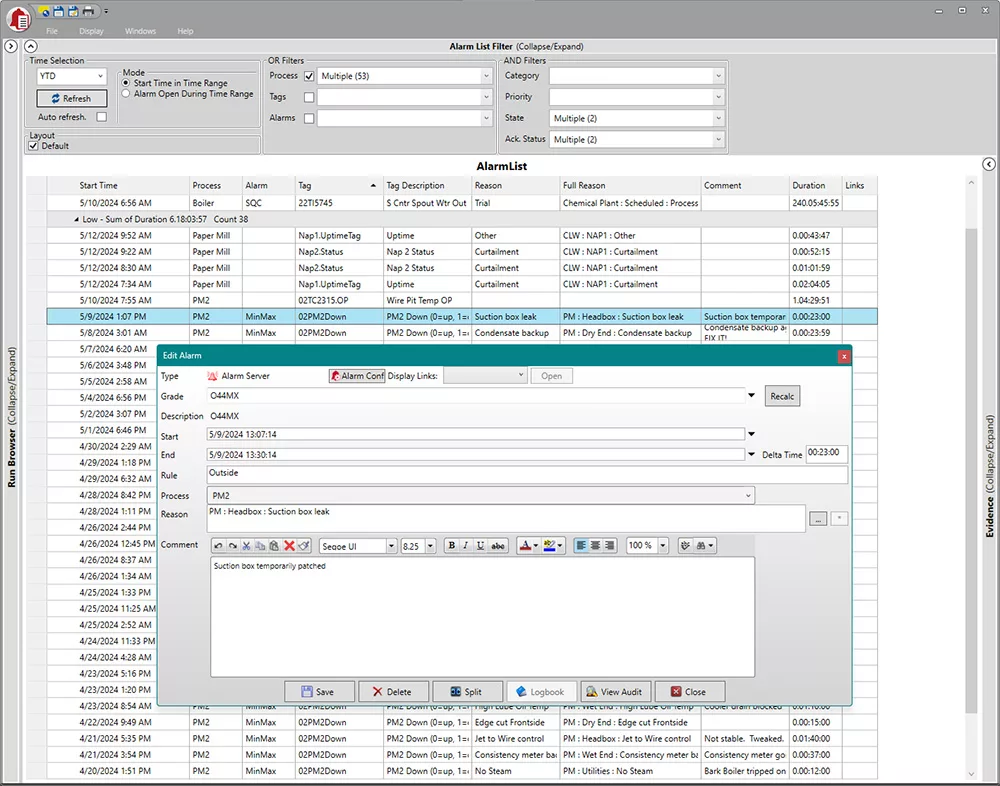
Easily manage and prioritize downtime events with an alarm list, allowing users to view, acknowledge, and assign reasons or comments to both current and past alarms, streamlining your automated downtime tracking and monitoring process.
1. Create Meaningful Events
Ultimately, you want to know if your machine is running or not, but it is helpful to subdivide machine downtime tracking and capture additional machine states. The key states are:
- Running – the machine is producing product
- Down – the machine is not producing product because of an unplanned issue
- Unscheduled – the machine is not producing product because it is not scheduled to run
- Starved – the machine is not producing product because an upstream machine is down
- Blocked – the machine is not producing product because a downstream machine is down
Ideally, the states would be determined by the machine control system, but it can also be done with calculations in the automated downtime tracking software itself. Downtime events can then be triggered by the machine state, and a start time and end time are recorded.
It is also a good idea to divide downtime into major and minor stops. Most people consider minor stops to be downtime events that are less than five minutes long and don’t require maintenance. Minor stops could include events such as jams, blocked sensors, or minor adjustments. Downtime events that are greater than 5 minutes are considered major stops and should be identified as either breakdowns or changeovers.
2. Assign Downtime Reasons
After a downtime event is created, a reason needs to be identified and assigned because knowing why the machine went down is essential for problem-solving. Some systems can automatically assign a reason based on the error code from the machine.
Operators can verify automatically generated reasons or select the appropriate downtime reason from a pre-determined list of common causes. Some companies even build the reason-picking functionality directly into the machine controls and require the operator to select a reason prior to starting the equipment back up.
This management system is a way to guarantee all downtime events get a reason assigned to them, but be careful because it could cause inaccurate data or frustration because the operator just wants to get the machine started again.
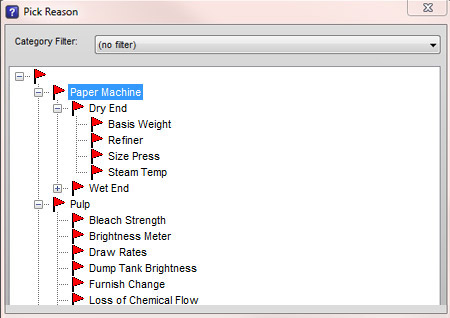
Easily track and categorize downtime events with the Reason Tree, a key feature in our OEE tracking software, enabling precise assignment of reasons to ensure accurate and actionable downtime analysis.
You need to have an appropriate list of reasons to be successful. The reason list should be small and standardized for each equipment failure type. You cannot work on everything at the same time. Most likely, you will prioritize and work on the top 3-5 downtime categories, so what benefit is there to having 30 reasons?
However, you want the list to be large enough so most events will be assigned a reason and not be categorized as “Other.” A list with 10-12 reasons is usually sufficient.
Also, don’t make the operator drill down too many levels into the reason tree to find the right reason. Just because the system has 4 levels, doesn’t mean you have to use them all.
Interested in improving OEE? See how our OEE & production monitoring tools calculate, report, & analyze production loss from downtime, lost opportunities, and process slowdowns.
3. Creating Reason Trees
When creating downtime reason trees, you should keep the following points in mind:
- Reasons should be distinct. It should be obvious to operators which reason applies, so you don’t end up with some people selecting one reason and other people selecting a different reason for the same direct cause.
- Reasons should be symptoms. The reason should describe a direct cause, not a root cause. You should not be asking operators to determine the root cause without some problem-solving activity. For example, the direct cause of the machine downtime might be a bearing failure. The root cause of the bearing failure might be lack of lubrication, which could ultimately mean a deficiency with the lubrication program in the facility.
- Only include frequent reasons. Do not include reasons that do not occur often because that only makes it harder to find the right reason. If you use an “Other” reason, it should not be a top cause. New reasons should be added to the list so the true causes are captured.
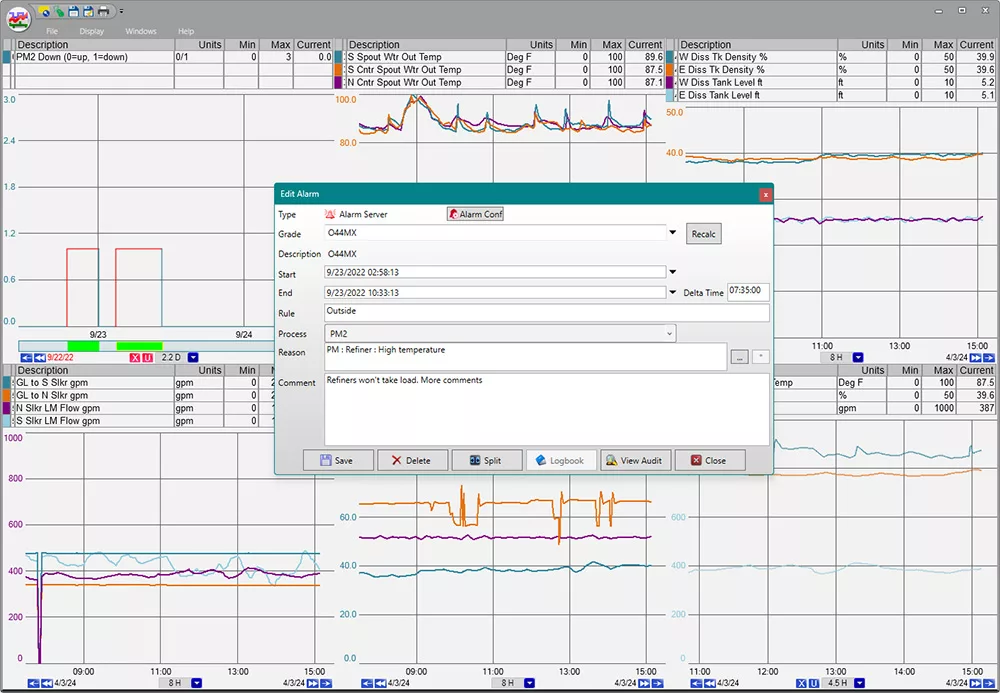
Easily track production losses directly from a trend. The acknowledge screen allows users to assign reasons or comments for alarms directly, ensuring precise production loss tracking and accurate OEE calculations.
4. Capture Downtime Event Attributes
There is additional automated data collection that you should consider collecting to help make the downtime data useful. The data collection should include:
- Process area or production line
- Machine name or number
- Product name or code
- Machine fault/error code
- Event duration
- Shift number
- Production date and time
- Operator comments (including any corrective actions)
Basically, you want to collect anything that can help identify who, what, when, where, and why for every downtime event. This is crucial information that will help you reduce downtime in the future. Also, it is valuable to get operator comments describing the event and any corrective actions performed in their own words.
You will get the most accurate comments at the time of the event and this also provides immediate communication. Reason categories can be used to identify top problems, but the operator comments can be invaluable when trying to identify the root cause. With practice and coaching you can start to get comments loaded with information.
Check out our real-time process analytics tools & see how you can reduce downtime & product loss.
5. Provide Real-Time Information For Real-Time Problem Solving
The best time to collect information and solve a problem with real-time data is when it is actually happening. After-the-fact reporting and problem solving is not as effective. How downtime data is viewed and by whom it is viewed is important for driving improvement. The data should be available continuously and not require complicated reports to be manually compiled after a long time has elapsed.
There are several ways to identify and react to the causes of downtime. Pareto charts are a common tool to visually show the top downtime reasons, either in terms of time or event count, in a given time period. It is a good practice to collect downtime data and develop a process for systematically addressing the chronic problems near the top of the Pareto chart.
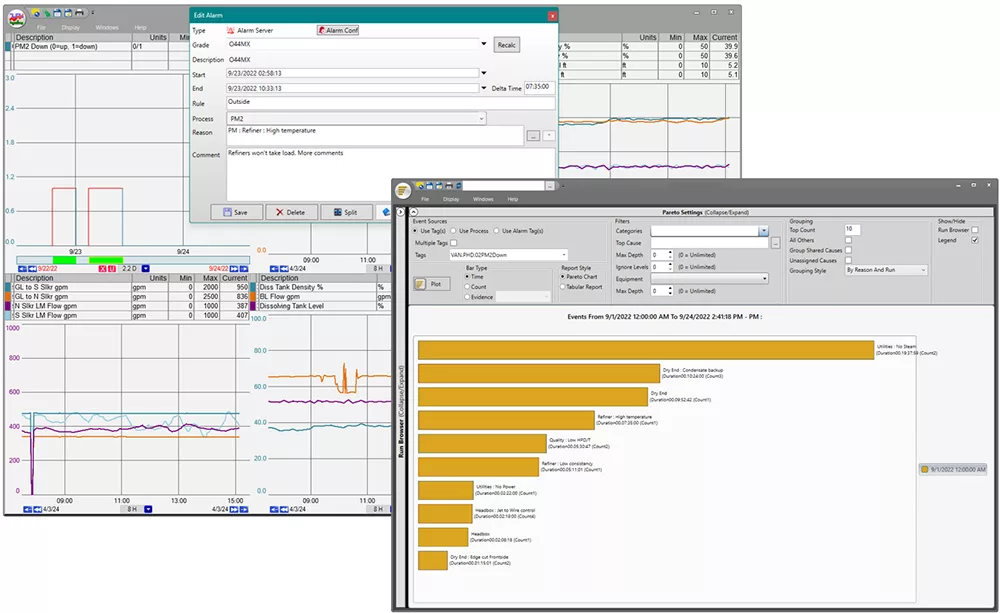
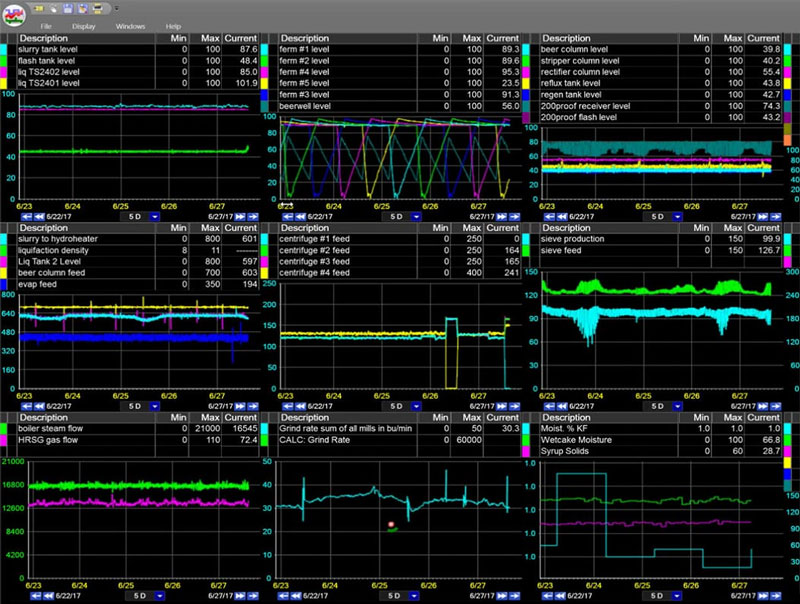
Utilize real-time data with trend displays and reason assignments for downtime. Turn this information into a Pareto chart to quickly identify the most common downtime causes, enabling effective problem-solving and minimizing production losses.
Trends and Gantt charts are also good visual tools that show a current timeline of downtime events.
Start Improving Downtime Tracking Today
Effective downtime tracking is essential for optimizing plant operations. With dataPARC, you can seamlessly monitor and analyze downtime events, enabling you to quickly identify root causes and implement corrective actions.
A comprehensive approach allows you to focus on running the plant efficiently, minimizing production losses, maintenance costs, and maximizing overall productivity. Start leveraging dataPARC’s advanced tools today to ensure your plant operates at peak performance and achieves sustainable success.
FAQ: Downtime Tracking
- Why automate downtime tracking?
Manual tracking is often inaccurate, inconsistent, and delayed. Automated systems capture exact start/end times, reasons, and context in real-time. That provides you with reliable data to identify trends and take immediate action. - Why are reason trees important, and how many reasons should you include?
Reason trees standardize categorization and make it easier to analyze root causes. Aim for 10–12 clear, distinct reasons per area or section. Frequent enough to cover common issues without overwhelming operators. Use dropdowns, not free text, to keep data clean and actionable. - What additional information should be captured in a downtime event beyond start and end time?
Capture event attributes like machine ID, shift, product code, fault codes, and operator notes. Contextual data like “who, what, when, where, why, and how” enables better analysis and faster corrective actions. - How often should downtime data be reviewed?
It depends on how critical it is to your site. It can be reviewed daily or even shift-by-shift in team huddles. Regular reviews keep issues visible, help drive accountability, and support a culture of continuous improvement. - What if operators don’t consistently assign downtime reasons?
This is a common challenge. The key is to make it easy and intuitive. Use simple reason trees, minimize required inputs, and provide training. Some systems also allow follow-up reason assignment so supervisors can help fill gaps accurately. Alternatively, send an email notification if it is not completed within one hour after the downtime has resolved. - Can downtime tracking help with preventive maintenance?
Yes. Tracking downtime events tied to equipment failure or minor stops can reveal early warning signs. That data can feed into a preventive maintenance plan, helping you fix recurring issues before they become bigger problems.
OEE: The Complete Guide
All the resources you need to successfully implement, analyze, & improve overall equipment effectiveness.