A lot of time and effort goes into the construction of the HMI screens and other display screens that are used to monitor and control production processes, so it is worth giving some time and thought to their layout and design. The most important consideration is how they can convey the most useful information in a timely manner to their intended audience.
This blog post deals designing process monitoring screens to better assist with troubleshooting efforts. It contains tips and guidelines on how to use PARCview’s graphics design tool, PARCgraphics, to address this goal. Also, check out our article, HMI Design Best Practices, for more tips.
Schematic Display Screens
Schematic screens designed for Distributed Control Systems (DCSs) tend to show a few pieces of equipment per page along with a lot of process data and status information. These screens permit access to all types and levels of information and controls, but aren’t necessarily good at showing the “big picture.” It is often necessary to scroll through multiple screens when attempting to trace flows through a process or unit operation.
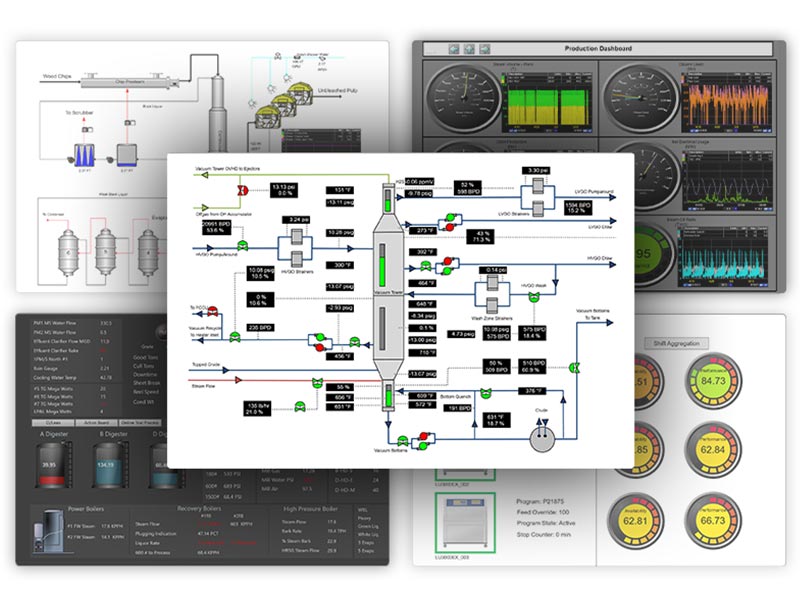
Schematic screens constructed using PARCview’s graphics tool, PARCgraphics, can supplement DCS screens and show larger areas or unit operations, often on a single page. This can serve two functions: it can educate people on process flows and connections, and it can also make it easier to monitor an area or unit operation by displaying the most critical values on one or two screens. PARCgraphics has thousands of equipment icons and screen controls available to construct sophisticated interactive PARCview display screens.
Monitor, report, & analyze production loss from unplanned downtime, poor quality, and performance issues.
Equipment Icons
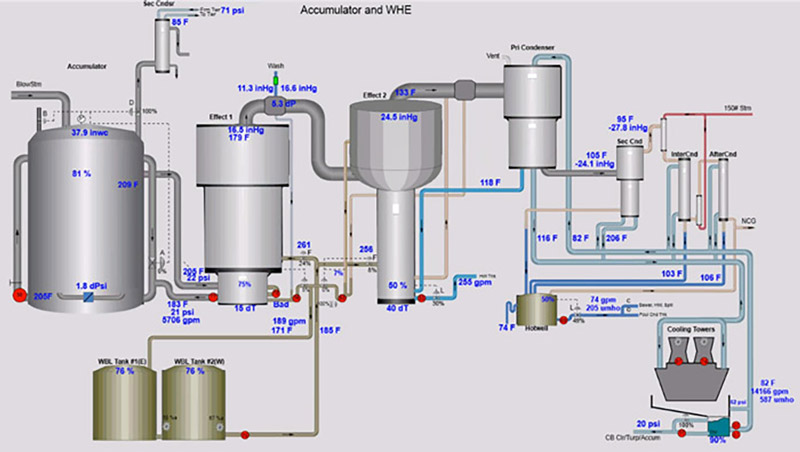
To improve process understanding and facilitate troubleshooting efforts, equipment icons on schematic screens should be positioned or grouped by their unit operations rather than their physical site locations. The relative sizes of the icons do not need to match their physical sizes. Rather, pieces of equipment which have more important attributes should be given additional space to allow all relevant process values, controls, and piping connections to be shown. For example, the tanks and cooling towers at the bottom of the PARCview screen below are physically much larger than the evaporators and condensers in real life, but because they have fewer critical attributes, their icon sizes are smaller.
Note that it is not necessary to fill every square inch of the screen with graphics – in fact, effective use of empty space can help keep the equipment grouped appropriately and improve understanding of the process.
Use Of Color
A general rule of thumb regarding the use of color on schematic display screens is that when color is used, it should mean something. Also, its use must be consistent. Color should NOT be used for aesthetic reasons – to make a graphic pretty or pleasing to the eye.
Some appropriate uses for color include:
Highlighting shared properties
Equipment or components which have the same contents or share properties (such as temperature or pressure) can be filled with the same color. For example, the tube-side and shell-side fluids in a heat exchanger can be given different colors to improve understanding of their process flows. With PARCgraphics’ Pipe tool, these colors can be extended out into the piping.
In the PARCview screen shown previously, the interior of the “Accumulator” and the tubes inside of “Effect 1” are colored pink to indicate that they contain the same fluid and are at equal pressures. Furthermore, the fill color is shaded from light to dark in each element to indicate temperature differences. Light-to-dark shading could also be applied to the two fluids inside the heat exchanger to indicate temperature changes.
Differentiating “live” data from labels
Different font colors can be used to differentiate “live” process data from text labels, while flashing or blinking text in a noticeable color like red can be used to indicate process values that are in alarm state. In the PARCview screen example, “live” tag values are in blue font while the label text is in less-noticeable black font. Note that PARCgraphics typically show current tag values but it can also be configured to display aggregated tag values, such as hourly averages, if desired.
Indicating different component states
Different icon colors can be used to indicate different states for valves, sensors, motors, and other auxiliary components. Different colors can be used to indicate ON, OFF, OPEN, and CLOSED states, for example. And because PARCview screens access “live” process data tags, these font color changes update continuously to reflect any changes as they occur in the process.
On the road to digital transformation? Get our Free Digital Transformation Roadmap, a step-by-step guide to achieving data-driven excellence in manufacturing.
Control Loop And Process Troubleshooting
Different fonts or font colors can also be used to indicate SP, PV, OP, and MODE control loop data on schematic PARCview screens. If an operator or engineer notices that one of these values doesn’t make sense, double clicking on that value on any PARCview screen will quickly bring up a time trend for that tag. Additional tags can be easily added to the trend by simply dragging them onto it, and the time frame that is displayed can be expanded or zoomed into in a matter of seconds. The ease with which trends can be viewed and manipulated provides much value to personnel trying to troubleshoot control loop and process issues.
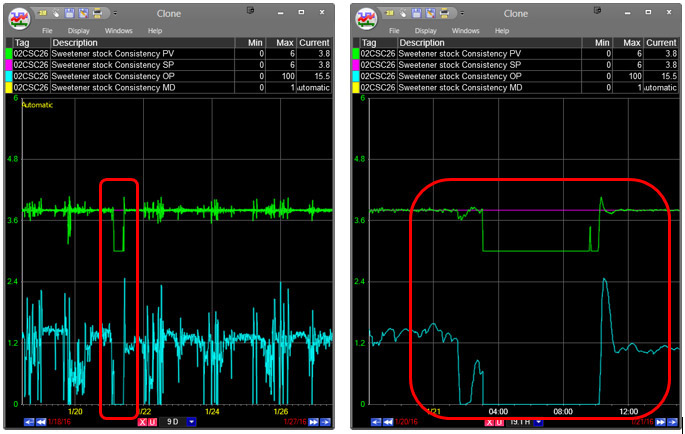
For example, in the first trend seen here, an operator or engineer might notice that a controller was having trouble keeping the sweetener stock consistency (PV) at its setpoint (SP) during a certain time period. He or she could quickly zoom into the data, as seen in the second trend, and then drag in related tags to try to figure out what was going on – swapping tags in and out, and zooming in and out as necessary.
Use of Layers
In some cases, it can be valuable to design schematic display screens with built-in layers. One layer can be used during normal operations to display critical process values and show major process equipment and connections. This layer can be removed and another layer exposed to show additional details, including internal components or compartments and support equipment like pumps and small heat exchangers, that weren’t included in the first layer. The more detailed layer can be useful in troubleshooting, training, and reference efforts. In PARCgraphics, layers can be created by linking object visibilities to a checkbox, slide bar, or other control on the screen.
As an example, the screen below is suitable for daily operations:
For training or troubleshooting purposes, one layer can be removed to expose the layer below, which shows internal elements and uses color to show common fluids:
Summary
PARCgraphics is an invaluable tool that can be used to create dynamic information-rich PARCview screens. These screens can be used to monitor production processes and unit operations on a daily basis, and they can also help with troubleshooting and training efforts when needed. With thousands of available equipment icons and controls, the ability to embed PARCview trends and other dynamic elements, and connectivity to real-time process data, it gives operators and other personnel the ability to make data-driven decisions when time is of the essence.
Time spent up front designing and creating process-based schematic screens that continuously display live tag data is an investment that can pay off for years to come. The ability to view process flows and connections, and see where the tag data is coming from in the process, can help educate new personnel and refresh the memory of experienced workers too!
Digital Transformation Roadmap
Download our Digital Transformation Roadmap and learn what steps you can take to achieve data-driven success in manufacturing.