The first step toward understanding and optimizing a manufacturing process is to collect and archive data about the process. Hopefully the system used to accomplish this is a “plant-wide” information system, or PIMS, which collects not just process data, but also quality information and laboratory results, and operations information such as upcoming orders and inventory.
Collecting data and putting it in a historian is relatively easy, and most control system suppliers and some third party software vendors offer this capability. The real value of a PIMS is determined by how that collected data is organized, how it is retrieved, and what options are available to help you garner meaningful conclusions and results from the data.
Problems With “Low-Resolution” Data
Scenario #1
Consider a situation where you have been asked to determine the average flow of steam supplied to a heat exchanger that is used to heat a product stream. No problem. You call up a trend of the last six months of steam flow data with the intention of using the averaging function that is built into the reporting package to generate your answer.
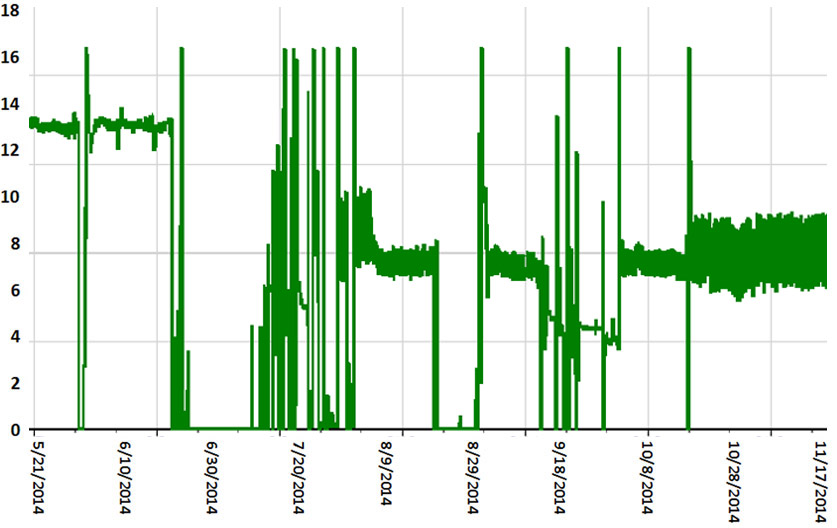
Missing data, or zero readings, make calculating averages difficult
Unfortunately, once the trend is up, you see that there are a few hours every day during which there is no product flow and so there is no steam flow. Since you are looking for the average steam flow during operation of the heater, your job just became more difficult. You have no choice but to export the data to a spreadsheet, manually eliminate the zero readings, and then calculate the average of the remaining valid values.
Scenario #2
Consider that you have been given another assignment.
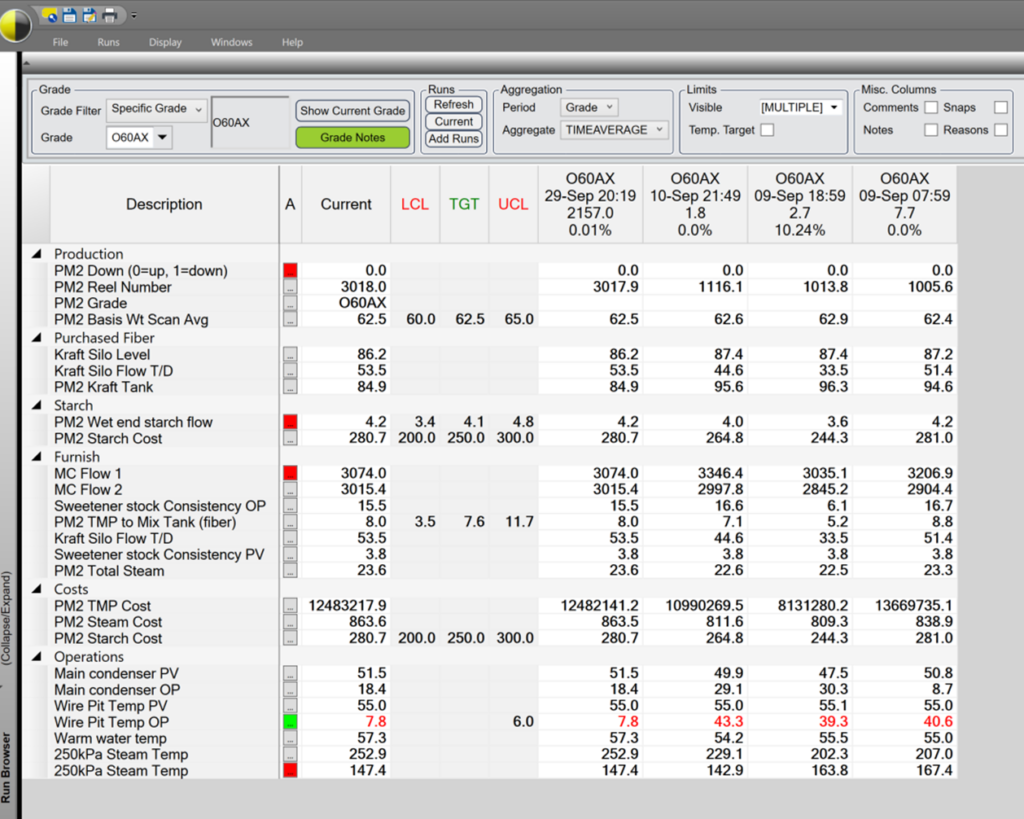
Most manufacturing facilities produce multiple variations of their product on each line. A toothpaste maker may periodically change the flavor; a papermaker may change the formulation of the furnish to make one type of paper stronger than another. These intentional process modifications give rise to the idea of “product runs” or “grade runs” and present significant challenges to data analysts.
Check out our advanced analytics tools & see how you can quickly optimize your processes.
It has been noticed that the last few times the high strength grade A346_SS has been run, an increasing number of reels have been rejected because the MD strength test was too low. Your job is to determine the cause of this problem. There are a number of steps required to address this issue. Depending on the PIMS analysis tools available to you, they may be easy or they may be tedious.
First, there are probably several dozen critical process variables that you will want to examine. If this grade is not frequently run, you may be required to pull all the data (for all grades) for those critical variables for a period of many months.
Returning that amount of data will probably take quite a bit of time. In the worst case scenario, you may have to make a separate query to determine the time periods when grade A346_SS was run, and then go through the data and manually extract those time periods for each process value.
Alternatively, your analysis software may allow you to apply a filter to your query to return only the data related to grade A346_SS. This will reduce the work that needs to be done to the data that is returned, but the extra filtering may very well further increase the query duration. Query durations are network and hardware dependent, but returning three or four dozen tags of high frequency data for a 6 month time period could easily take more than 15 minutes.
Getting Better Performance From Your Data
PARCpde – Data Rollup Engine
A system which requires too much work to condense the data, or takes too long to retrieve it, is only marginally useful to the people who need it. dataPARC has developed a method and a tool to address this issue.
PARCpde (PARC performance data engine) is a flexible real-time data aggregator which can work with any historian to provide fast access to large ranges of historical data in seconds. PARCpde is used to aggregate, or “rollup”, data as it is created.
Aggregates can be based on predefined time periods (hours, days, weeks, months) or custom periods, such as shifts or production months. In order to address the issue of grades, the aggregation period can be a flexible time period which is specified based on a production parameter like grade number or production run ID.
For each aggregated period, a number of statistics are automatically calculated and stored, including averages, durations, minimums, maximums and standard deviations.
Filter criteria can be further applied to the aggregated data. For example, a “downtime tag” could be identified and used as a filter, so that only the process values during active production would be aggregated into the statistics.
Condensing process values into statistics for predefined periods in an ongoing manner avoids the time consuming task of having to manually sort values and calculate statistics every time a question comes up. The aggregated statistics become properties of the base tag and do not require creation of a new tag. Finally, if you want statistics for a tag which had not been previously configured to be aggregated, it is possible to easily add that tag and backfill statistics for a specified period of time.
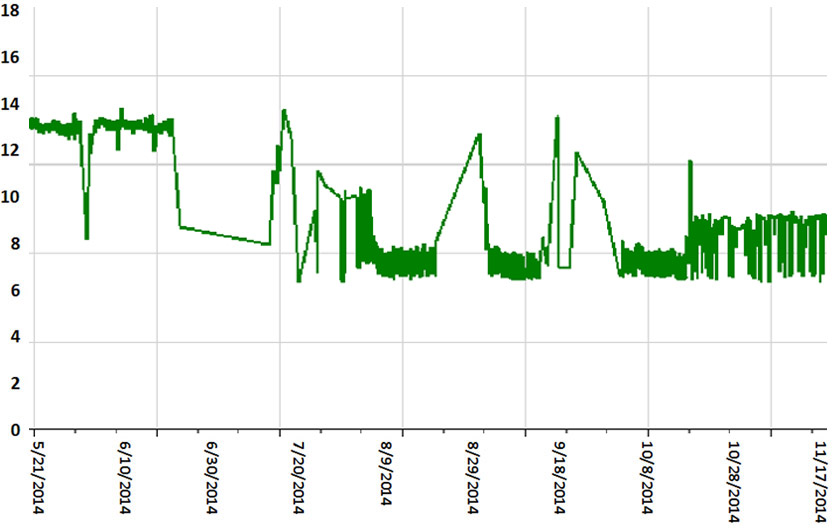
The same steam flow data trend we saw earlier, aggregated and filtered to show weighted averages.
Simply possessing large amounts of stored data does not solve problems or increase productivity. Unless the proper tools are in place to use and interpret that data, it will not be useful. High frequency data, or readings taken every few seconds, can be valuable.
However, if the goal of a particular analysis task is to compare conditions over a long period of time, having to recall and process thousands of data points per hour becomes an impediment rather than an advantage. The best solution is to use a PIMS which has quick access to both aggregated historical datasets and high frequency detail data, and is equipped with the tools to seamlessly move between the two data types.
OEE: The Complete Guide
All the resources you need to successfully implement, analyze, & improve overall equipment effectiveness.