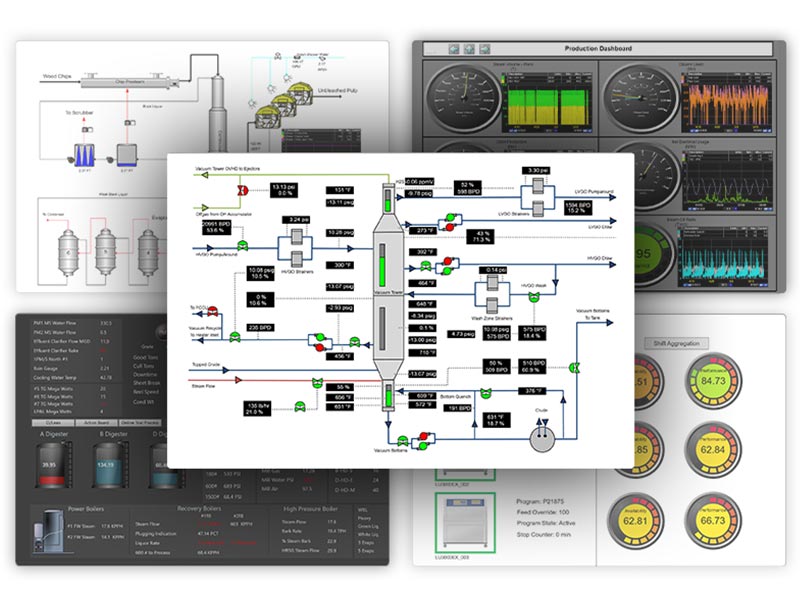
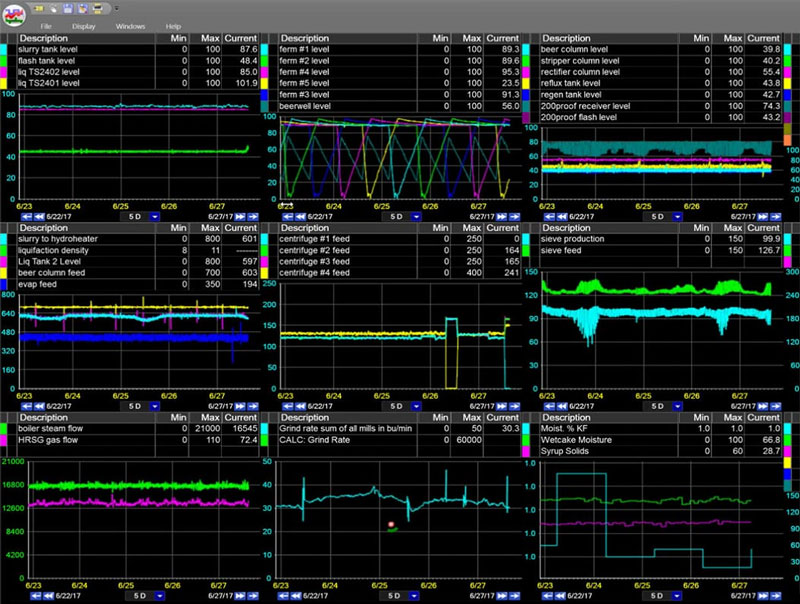
Historian packages were originally intended to help operators and engineers understand and operate manufacturing processes. Current and historical data was constantly displayed on a dedicated screen next to the primary control screens, and users were intended to interact with it at that location more or less continuously.

Build Real-Time Reports & Displays with your Historian Data
As the data historian became a one-stop source for all types of data throughout a facility, it became a tool that could benefit supervisory and management personnel as well. This led to the development of a variety of remote notification and reporting tools to meet the somewhat different needs of these individuals.
Historian Data Reporting Fundamentals
Basic Reporting
Most of the leading historian and data analysis software packages available to process industries offer some fundamental reporting functions. At the most basic level, reports can be configured to distribute emails to one or more people based on a single tag going beyond a set limit. A separate notification can also be sent at the time an operator enters a reason for the excursion, and also when the variable returns to a value within the limit. Getting reports set up with these basic descriptive analytics is a key first step.
Scheduling Reports
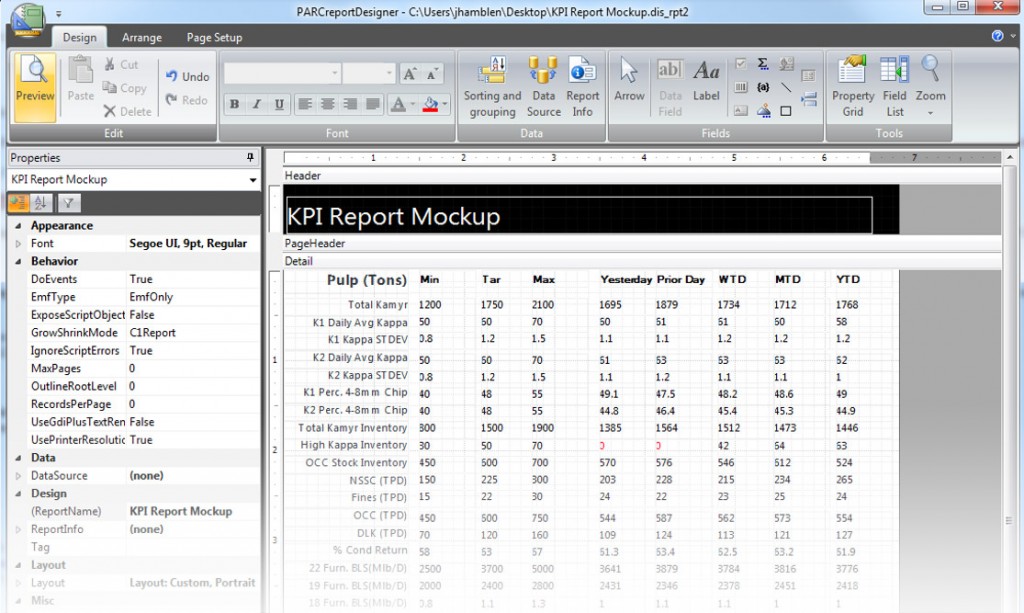
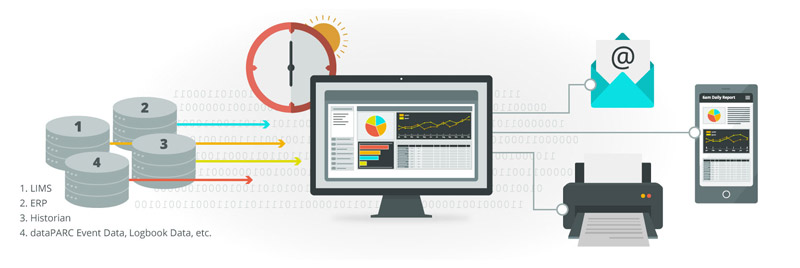
At the next level of complexity, the system can populate and send an entire report, based on an event or a preset time schedule. Reports can be as simple as a snapshot showing the current values of a few KPIs, or as complex as a multipage report containing tables, process graphics, charts and trends. dataPARC’s PARCview application, for instance, has a built-in, flexible and easy to use module for developing report templates.

dataPARC’s PARCview offers the ability to create and schedule custom reports.
PARCview also offers an add-in which allows data to be shown within Excel. For people who are proficient with the tools within Excel, this is another avenue for creating reports. Reports created in Excel can be viewed natively in Excel or exported as .pdf or .html files for viewing on a wide range of platforms. Production, raw material consumption and environmental compliance can all be easily tracked by periodic reporting, and any deviations can be quickly spotted and rectified. Receiving a daily report just before a morning meeting provides a quick way to avoid unpleasant surprises at the meeting.

Daily plant overview reports are a good way to make sure everyone’s on the same page each day.
Mobile Notifications
PARCmobile is a natural extension of report distribution. Reports delivered to mobile devices help answer the question “Is the plant running well?” If the answer is No, the next question is “Why?”. Whether links to key displays are provided with the report or users choose their favorite trends or graphics, PARCmobile deliver access to all of the data within dataPARC. Live trends and graphics make it possible to take the next step, beyond a single number or notification, and perform a wide ranging investigation of any process irregularities.
Reporting Best Practices – Right Information To The Right People At The Right Time

Different people have different methods of working. Not all reporting needs are the same. A process engineer troubleshooting a particular problem will want more granular, higher frequency reports focused on a particular area, at least for the duration of the issue, than an area manager who is monitoring multiple processes to make sure that they are generally on track. Nonetheless, here are some guidelines that will apply to most remote users most of the time:
Less is More
Minimize the number of notifications that you receive, and choose them wisely. If you receive an email for every minor process excursion, their importance will diminish and you are liable to not notice or respond to an important notification. Focus on watching only crucial KPIs.
Keep it Simple
Similarly, reports should be simple. The primary purpose of mobile notification is to be alerted to new or potential problems, not to find causes or solve those problems based on the report.
Embrace the PDF and Archive
However reports are constructed, export them in .pdf format. This is a standard format which offers easy scalability and works well on virtually all software and hardware platforms. PDF’s also provide a great way to archive reports for easy access.
Group Important Notifications
Use the group function to notify everyone who might be affected by a process excursion. For example, if high torque in a clarifier is detected due to high solids coming in from a process sewer, all areas which are serviced by that sewer should be notified. Doing this will hopefully result in the problem being solved more quickly, as each area checks on their contribution simultaneously, rather than each area looking in sequence, only after each downstream contributor reports their results.
Delay Notifications
Incorporate dead banding and/or delay into your notifications. Again, this depends on your job role, but for most remote users of data, unless an excursion presents a safety hazard or compliance issue, you don’t need to know about it immediately. Minor excursions can resolve themselves or be handled by frontline operators. Delaying notifications helps to minimize their frequency by filtering out the minor issues from the major ones.
Conclusion
Having the right eyes and brains monitoring a process will lead to problems being addressed more effectively and keep the process running more profitably. Notification and reporting functions are one way to help deliver the right data to the right people at the right time. Different people need different pieces of information at different frequencies, so having the flexibility to configure the report and distribution rules is key. dataPARC provides solutions to these problems for users with existing historians or those still looking to make that investment.


