The interest in and application of industrial analytics has grown rapidly in recent years. This is driven by manufacturers’ desire for a “data-driven” approach to production that can reduce costs and increase revenue. And, with the widespread adoption of the Industrial Internet of Things (IIoT) and the increasing availability of industrial data. The need for sophisticated analytics solutions by manufacturing companies has never been greater.
However, “industrial analytics” is not particularly well-defined despite this growth. The numerous software platforms that promise to help companies make sense of their industrial data use the same buzzwords and fuzzy terms to describe a wide range of process data analysis toolkits that can differ in features and purpose.

In general, we can identify two categories of industrial analytics: advanced analytics and operational analytics. These categories are not mutually exclusive, and many industrial analytics platforms offer features that borrow from both. In this article, we’ll take a closer look at each category and explore the benefits and limitations of each.
Key Tools for Industrial Advanced Analytics in Manufacturing
Process Engineers use software every day for a range of reasons.
The term advanced analytics covers a lot of ground. On one end, you have relatively simple data visualization and trending applications that allow you to view real-time or historical data from the systems and equipment in a plant. Additionally, you have sophisticated algorithms and statistical models designed to analyze large amounts of data. They identify trends and patterns and make predictions about future events.
Check out our advanced analytics tools & see how you can quickly optimize your processes.
It is common to describe advanced analytics as a group of four separate types of analytics:
- Descriptive analytics
- Diagnostic analytics
- Predictive analytics
- Prescriptive analytics
Some would argue (as we will here) that it’s only the final two types, predictive and prescriptive, that can truly be described as “advanced,” as they’re the only types of analytics using sophisticated artificial intelligence, machine learning algorithms, and other advanced techniques to drive process optimization.
These types of analytics are also advanced in the sense that they’re only able to be utilized by organizations that are fairly mature or “advanced” in their use of data in their day-to-day operations.
Essential Prerequisites for Advanced Analytics in Manufacturing
As we said before, not every organization is set up to begin using advanced analytics. Manufacturers in earlier stages of digital transformation may not even be making use of a historian to collect their time series data. Or, they may have some data in a historian, but other critical data is stored in various other systems throughout the supply chain and the plant.
For advanced manufacturing analytics solutions to be effective, all-important manufacturing data needs to be aggregated and accessible by external applications in order to derive predictive or prescriptive insights from it.This requires a data integration system, like dataPARC, that can aggregate data from different sources, add context to it, filter it, and standardize it so it can be used. This is often referred to as data valorization.
Many companies still need the process data historian for manufacturing piece; they need the aggregation and valorization, and other foundational elements before they can even take advantage of “advanced” analytics.
Types of Advanced Analytics in Manufacturing: Predictive & Prescriptive
Using Predictive Analytics in Manufacturing
Predictive analytics tools use algorithms and statistical models to analyze large amounts of historical data, identifying patterns, trends, and relationships between variables that can be used to make predictions about future events or outcomes.
This type of analytics is particularly useful in predictive maintenance for predicting equipment failure and anticipating maintenance requirements. Predictive analytics can also help organizations identify opportunities for to improve manufacturing efficiency and reduce waste.

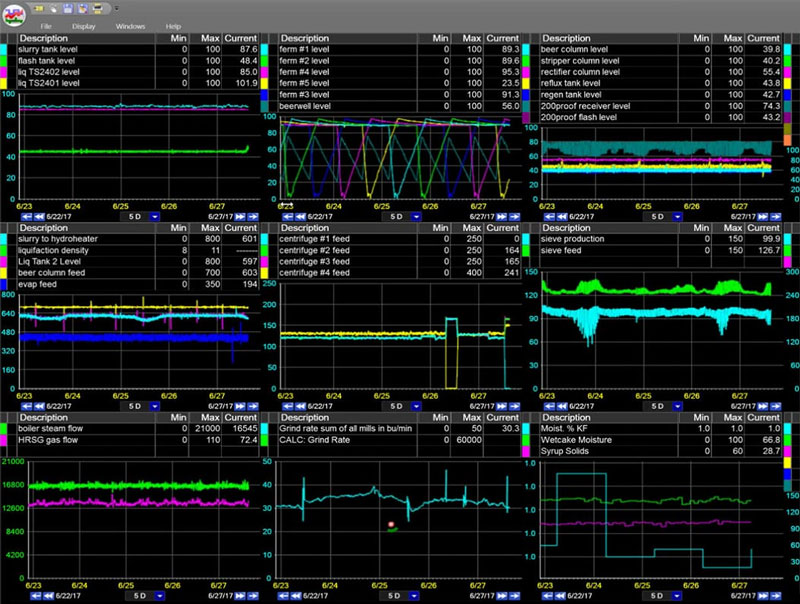
This display is an example of a predictive model. They can help organizations identify opportunities for improving efficiency, cutting costs, and reducing waste.
Predictive analytics can help organizations make more informed decisions by providing insights into what might happen in the future, allowing them to take proactive measures regarding process deviations, scheduled downtime, resource management, and other areas of planning to maximize uptime and throughput.
Manufacturing with Prescriptive Analytics
Prescriptive analytics takes the baton from predictive analytics and recommends specific actions or decisions based on the insights gained from predictive analysis.
Prescriptive analytics models use a combination of historical data, business rules, and optimization algorithms to identify the best course of action in a given scenario. These are just some of the many manufacturing process optimization strategies avaiable. For example, prescriptive analytics can be used to optimize production schedules to minimize downtime or for demand forecasting to determine the optimal inventory levels to minimize costs while ensuring adequate stock. Determine the optimal inventory levels to minimize costs while ensuring adequate stock.
Mastering Manufacturing Metrics: The ultimate guide to establishing, measuring, & reporting KPIs for peak plant performance.
Who uses Advanced Analytics Tools?
Advanced analytics tools can be incredibly powerful, but their use is often limited to one or a few specialized team members tasked with solving very specific problems. They’re specialized tools for special projects.
Data Scientists and Subject Matter Experts
Larger facilities that generate a significant amount of data and have a focus on data-driven decision-making are more likely to have a data scientist or a team of data scientists on staff using advanced data analytics tools to help optimize enterprise-wide operations. Subject matter experts (SMEs) in highly technical processes may serve a similar role and use predictive analytics and advanced modeling applications when designing or optimizing products.
Process Engineers
Process engineers at any size operation often use advanced real-time manufacturing analytics software to help them optimize production. Advanced models can help engineering teams predict equipment failure, estimate process variables, and perform analysis to help reduce waste and improve product quality.
Operational Analytics in Manufacturing: Key Features for Data-Driven Operations
Where advanced analytics tools are used by specialists to solve specific problems, operational analytics are a broad range of analytical techniques designed to be used by everyone at the plant in support of day-to-day operations. These techniques include: real-time production data on-time monitoring, centerlines, control charts, alarms, reports, and more.
Operational Analytics platforms provide the foundation for data-driven manufacturing operations and supply chain management. Tools like dataPARC can be used to aggregate data from different sources and transform that data so it can be used for production monitoring, root cause analysis, and even in advanced predictive and prescriptive analytics projects.
There are many different operational analytics tools available. Some software developers bundle many of these tools together to provide more robust platforms, while others focus exclusively on one or two features in more specialized applications.
Drive process consistency and reduce unplanned downtime with this operational analytics toolkit.
Let’s take a look at some common components of operational analytics platforms.
Types of Operational Analytics in Manufacturing
Descriptive Analytics in Manufacturing Performance
Descriptive analytics involves analyzing data in order to better understand what happened in the past. Not quite “advanced”, this is the base function of the classic paring of a process data historian and trending tools.
Descriptive analytics can be used to track key performance indicators (KPIs) and monitor progress towards goals. For example, descriptive analytics for manufacturing can help engineers and operators look back in time and see when a process variable deviated from its target operating range or help organizations make informed decisions about the allocation of resources and the development of strategies based on seasonality or other historical trends.

Descriptive analytics can be used to track key performance indicators and monitor progress toward goals.
Descriptive analytics is particularly useful for identifying areas where performance improvements can be made by benchmarking against industry standards or specific operating ranges defined as “golden” runs. Also, utilizing batch analysis tools for batch processes.
Diagnostic Analytics in Manufacturing
Diagnostic analytics goes beyond understanding what happened and uses data to identify why something happened, uncovering the root cause of problems within a process.
This type of analysis is particularly useful in identifying problems with equipment, processes, and systems and can provide valuable insights into the root causes of performance issues.
Diagnostic analytics can be used to identify the factors that contribute to a particular outcome, such as identifying the source of a quality issue or production bottleneck. Diagnostic analytics, such as 5 why root cause analysis, helps operators and engineers to understand the cause-and-effect relationships between different variables, which can then be used to optimize processes and improve overall performance.
For example, a diagnostic analysis of maintenance data may reveal that a particular component failure is associated with a specific production process, leading to the implementation of preventive measures that reduce downtime and increase equipment reliability.
Real-Time Monitoring in Manufacturing to Enhance Operational Analytics
A primary goal of “digital transformation” efforts in the manufacturing industry is to be able to use data to push the entire enterprise forward by providing a shared understanding of current operating conditions and desired production outcomes.
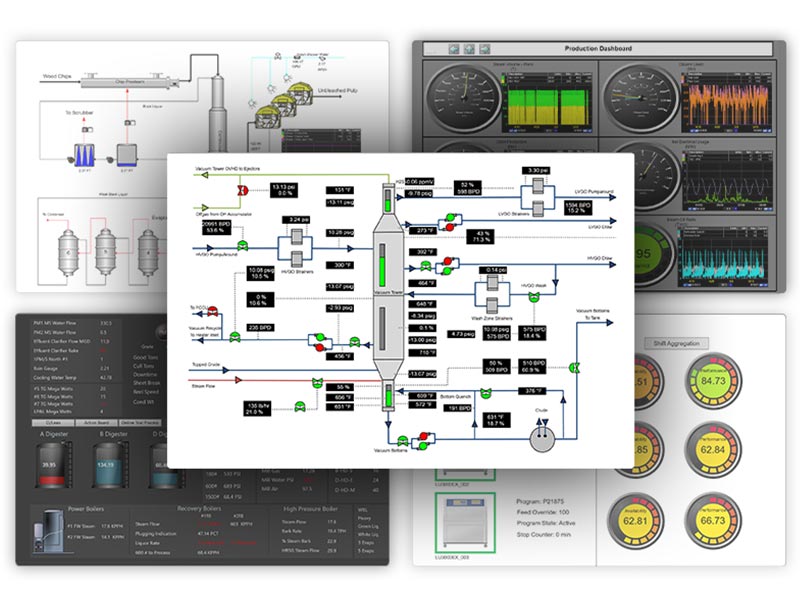
Because of this, real-time production dashboards and process graphics are at the core of data-driven manufacturing operations. These operational analytics tools allow everyone at a facility, from the plant floor on up, to focus on the most critical manufacturing processes and KPIs, and to respond quickly to process deviations or unplanned downtime events.

Real-time production dashboards and process graphics are at the core of data-driven manufacturing operations.
Sophisticated process monitoring tools allow manufacturers to build digital twins of their operations, offering at-a-glance visual representations of each process area – complete with real-time values for key process variables.
Applying Statistical Process Control (SPC) in Manufacturing
Once a process has been designed to run optimally, it’s important that it remains running optimally. Operational analytics tools like limits, control charts, and centerlines establish a baseline for expected process performance and make it easier for operations teams to maintain control over a process.

Tools like limits, control charts, and centerlines establish a baseline for expected process performance.
Control charts and centerlines are graphical operational analytics tools used to represent the target value or desired level of performance for a manufacturing process. The centerline is typically based on historical process data or engineering specifications and serves as a reference point for monitoring process performance over time.
Limits are defined as the upper and lower boundaries within which a process is expected to operate in order to produce products that meet quality specifications. Operational analytics platforms often employ limits used in conjunction with alarms to alert operations teams via email or even SMS text message when a process is out of control or producing products that are out of spec.
Reporting in Manufacturing: A Critical Aspect of Operational Analytics
It may feel like a stretch to call reports a form of “analytics”, but if analytics simply refers to interpreting and communicating data, an old-fashioned report is probably the most common piece of analytics in manufacturing.
Various reports are used to communicate manufacturing performance. A single facility may produce reports detailing performance against KPIs for production, quality, maintenance, inventory, and more.

An old-fashioned report is great at communicating plant performance.
Modern operational analytics platforms almost universally offer at least basic reporting functionality, with more advanced platforms providing feature-rich tools for designing custom reports that can be scheduled for delivery via email or triggered to be emailed immediately in case of unplanned downtime or other events.
Who uses Operational Analytics Tools in Manufacturing Organizations?
Well, everyone, really. One of the biggest differences between advanced analytics and operational analytics is that operational analytics are intended to be applied from the plant or shop floor and on up. Whereas advanced analytics projects are often undertaken by a single team using complex tools to solve complex problems, operational analytics gain utility by “democratizing” data and providing teams at every level with access to tools that they can use to contribute to improving plant performance.
Operations Teams
Operations teams rely on operational analytics tools like centerlines and control charts to maintain process consistency and drive deeper process understanding. Some platforms include built-in tools for 5 Why analysis and other troubleshooting methods that can elevate operators’ diagnostic analytic skills nearer to a process engineer’s.
Engineering Teams
Process Engineers heavily utilize the diagnostic capabilities of operational analytics platforms in root cause analysis exercises. Some of the most powerful trending tools can enable engineers to analyze large amounts of historical fast enough to untangle complicated process issues in minutes.
Integrating IT & OT data at your plant? Let our Digital Transformation Roadmap guide your way.
Quality & Lab Teams
Often working in cooperation with engineering teams, quality and lab teams can develop homegrown Lab Information Management Systems (LIMS) using the manual data entry capabilities of some of the more flexible operational analytics platforms. Storing and trending manually entered lab data alongside other production data allows engineering and quality teams to identify the source of process issues and reduce out-of-spec products.
IT Operations
As the IT and OT worlds continue to converge, flexible data integration for manufacturing analytics platforms often provides the key to data integration. Some of the more powerful systems, like dataPARC, offer tools that make it easy for high-resolution data to be used for site-level troubleshooting and analysis, while low-res, aggregated data can be used for high-performance at remote sites and corporate HQ.
Senior Management
Management teams are typically the end users of the reports and high-level production dashboards that are produced by operational analytics platforms. Having a single source of truth available to all personnel at an entire plant or an entire multi-site enterprise enables more effective strategic decision-making and corporate uniformity.
Manufacturing Operational Analytics Prerequisites
Many of the same foundational pieces needed for advanced analytics in manufacturing are also required to fully take advantage of operational analytics. It’s one reason a data integration system like dataPARC is the perfect place to start. Even organizations with years of experience collecting and analyzing data can derive significant value from a solid data foundation.
When deciding on advanced analytics vs operational analytics, it is important to consider the specific needs of your organization. If you have all of your fundamental data management functions covered (historian, integration, valorization, descriptive & diagnostic analytics) and you’re looking to get the very most from the processes you’re already monitoring and controlling, then advanced analytic tools in the form of AI or ML driven predictive or prescriptive applications can help you maximize performance.
On the other hand, if you’re still in the early stages of your digital transformation or if you simply haven’t managed to realize the benefits that come from the data you’re currently collecting, a broad set of operational analytics tools will provide a much bigger bang for your buck in terms of ROI.
With manufacturing data analytics and the right solution in place, you can unlock the full potential of your data and gain valuable insights into the performance of your equipment, processes, and systems.
Want to Learn More?
Download our Digital Transformation Roadmap and learn what steps you can take to achieve data-driven success in manufacturing.