In this blog, explore what real-time manufacturing dashboards are, why they are crucial, and how to implement them effectively. Learn about the main types of manufacturing dashboards—from operational overviews to performance metrics. Discover how integrating real-time manufacturing dashboards can transform your production processes, increasing efficiency and ensuring a safer, more productive manufacturing environment.
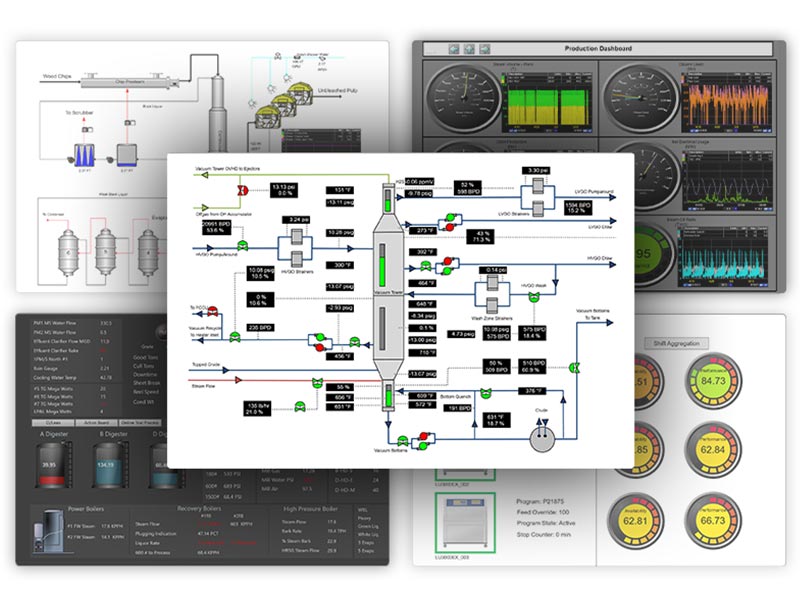
Build Real-Time Dashboards & Displays for Effective KPI Monitoring with dataPARC
What counts as real-time manufacturing dashboards?
A real-time manufacturing dashboard is a dynamic tool that displays production data and manufacturing KPIs (key performance indicators) as they happen. The ability to monitor an entire process without from a centralized location creates a safer work environment. It also allows users to use data-based decision-making to optimize production and improve performance.
There are several types of real-time manufacturing dashboards. Many are common to have in every manufacturing industry, while others may only be specific depending on the company’s goals. Each real-time data manufacturing dashboard has its own purpose and uses within the manufacturing environment:
Operational Overviews:
Operational overviews might be one of the most common types of manufacturing dashboards. They illustrate the process area, including pipelines and pumps. More detailed overviews can also show pipe flow direction. Operational dashboards can provide a snapshot of a process area, offering quick access to more granular data when needed.
They are invaluable for detecting immediate issues like equipment failures or process disruptions, enabling swift responses to prevent downtime or production delays. They can also be great training tools for newer operators or engineers just learning the process.
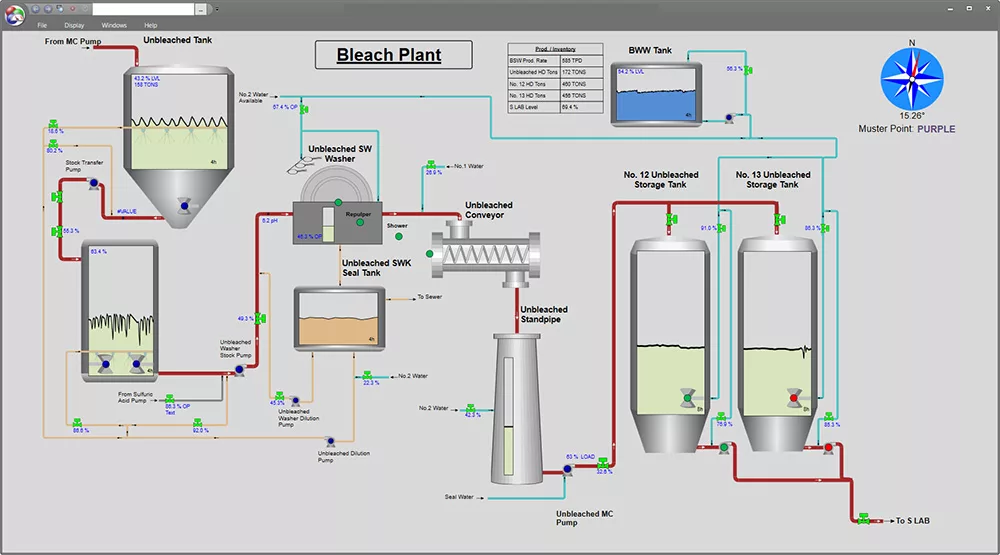
Operational overviews like this are perfect for training and visual learners. This comprehensive view lets you see the entire process at once, connecting big data in manufacturing to visual elements for an enhanced understanding of operations.
Financial Dashboards:
A financial dashboard, while not directly related to the production or shop floor, can offer real-time insights into cost-related metrics. In terms of manufacturing data, a financial dashboard could look at operational costs, return on investment (ROI), and cost per unit, linking financial outcomes to production activities. An example of this is performing real-time grap tracking.
Performance Dashboards:
Performance production dashboards focus on efficiency and productivity. They display key metrics, such as Overall Equipment Effectiveness (OEE), machine speed, production rates, and quality indicators. As the name implies, performance dashboards help manufacturers track performance against goals and identify areas for improvement. Building effective KPI dashboards and reports is pivotal to all departments. These can often be used as maintenance dashboards as well.
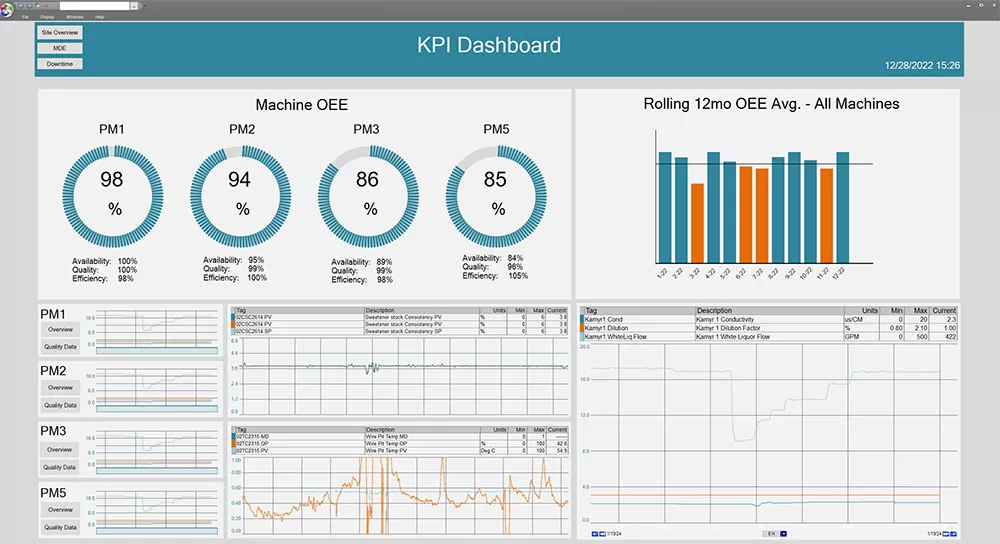
In this real-time manufacturing dashboard, view real-time OEE metrics across multiple machines and easily navigate to detailed overviews with just a click, enhancing productivity and monitoring efficiency.
Energy Consumption Dashboards:
With a focus on sustainability and cost-saving, these dashboards monitor real-time energy usage and efficiency across different machines or process lines, aiding in identifying energy-saving opportunities.
Quality Dashboards
Quality dashboards are essential tools that display lab and quality data, ensuring that manufacturing processes adhere to specifications. These dashboards are particularly crucial in industries where production quality and extensive testing are fundamental to the success of the operations. These dashboards allow for immediate corrective actions and continuous process improvement by providing real-time access to quality metrics.
Benefits of Using Real-time Dashboards
By integrating different real-time manufacturing dashboards, manufacturers gain a multi-faceted view of their operations. This enables them to optimize performance, keep production volume up, reduce costs, and improve decision-making processes.
Increased Operational Efficiency:
A real-time dashboard can significantly increase operational efficiency by providing a holistic production process view through customizable displays. Unlike traditional DCS screens that may show only a handful of data points simultaneously, dashboards can display dozens or even hundreds of relevant machine data simultaneously.
The design of these dashboards allows for the configuration of “always-up” displays. This means a select dashboard or two is always open, and it has critical metrics, trends, and alarms across multiple process areas. Operators are no longer required to cycle through multiple screens to gather necessary information.
By consolidating vast amounts of machine data, real-time dashboards reduce the cognitive load on operators. They are able to focus on optimizing processes rather than just monitoring them.
Optimized Production:
With the help of real-time dashboards, operators can identify trends in the process, which can be used to optimize production. For instance, with customized alarms, operators are immediately alerted to anomalies or deviations from standard performance metrics. They can address these issues swiftly before they lead to production halts or equipment damage.
Moreover, dashboards facilitate an interconnected view of the plant operations. Operators in downstream areas, for example, can access operational overview dashboards to monitor the status of upstream processes.
This integrated monitoring benefits twofold: it reduces the dependency on manual communication between departments. Which can be slow, especially during critical situations. It also ensures that production continues smoothly despite potential disruptions. This approach optimizes resource use, minimizes waste, and enhances the overall responsiveness of the manufacturing process.
Enhanced Safety:
Utilizing real-time dashboards can enhance safety within a manufacturing company. This centralized monitoring reduces the necessity for frequent on-site inspections, which often involve navigating potentially hazardous areas. Dashboards can be detailed to include critical safety indicators, video streams, and real-time alerts that can preemptively signal the onset of unsafe conditions.
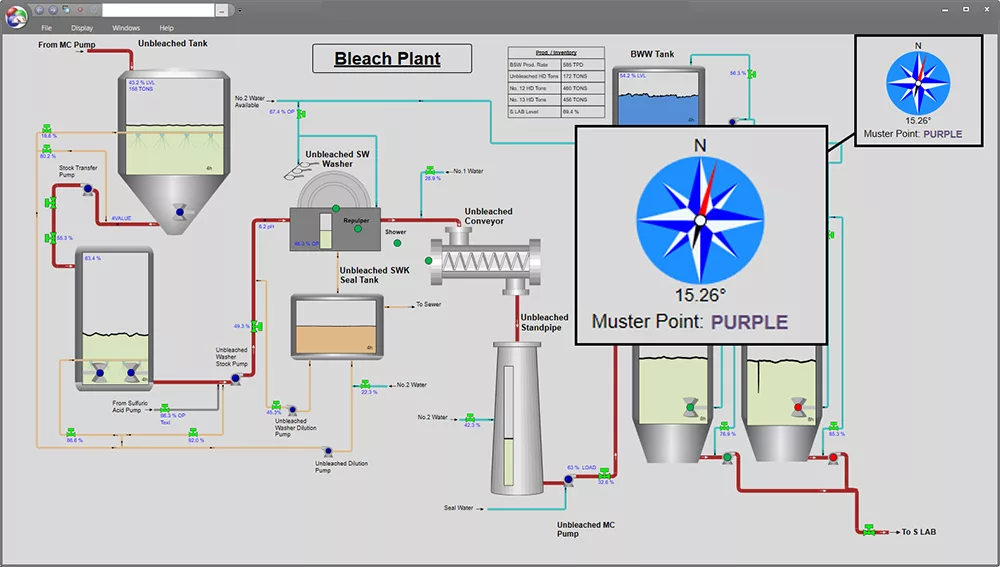
Due to dangerous chemicals, depending on the wind direction, the muster point can change. This is a critical variable for employees in the event of an evacuation.
Real-time dashboards also play a crucial role during emergencies by providing operators with immediate data on the areas affected. This information is vital for coordinating an effective response and keeping employees safe.
Improved Communication and Training Tools:
Real-time dashboards are powerful information tools that significantly enhance communication within manufacturing operations. By consolidating critical data into an easily accessible platform, these dashboards ensure that every team member, from operators to supervisors, has access to the same real-time information.
Additionally, by integrating alerts and notifications into these dashboards, communication can be automated and targeted. If specific conditions are met or thresholds are exceeded, the system can automatically notify the relevant personnel, who can take immediate action.
Operational dashboards are excellent training tools since they are rich with historical data. These dashboards include process flow diagrams, images, and detailed information about machine data, including production volumes and actual production values. This wealth of information is invaluable for new hires, helping them quickly understand critical operational metrics and familiarize themselves with the intricacies of the production environment.
5 Examples of Powerful Dashboards
1. Batch Digester Operational Overview
The operational dashboard for a batch digester exemplifies the power of real-time manufacturing visualization. Displaying over 400 tags, this dashboard offers a comprehensive view of the process, including tank levels, pump status, valve positions, and temperature readings throughout the system.
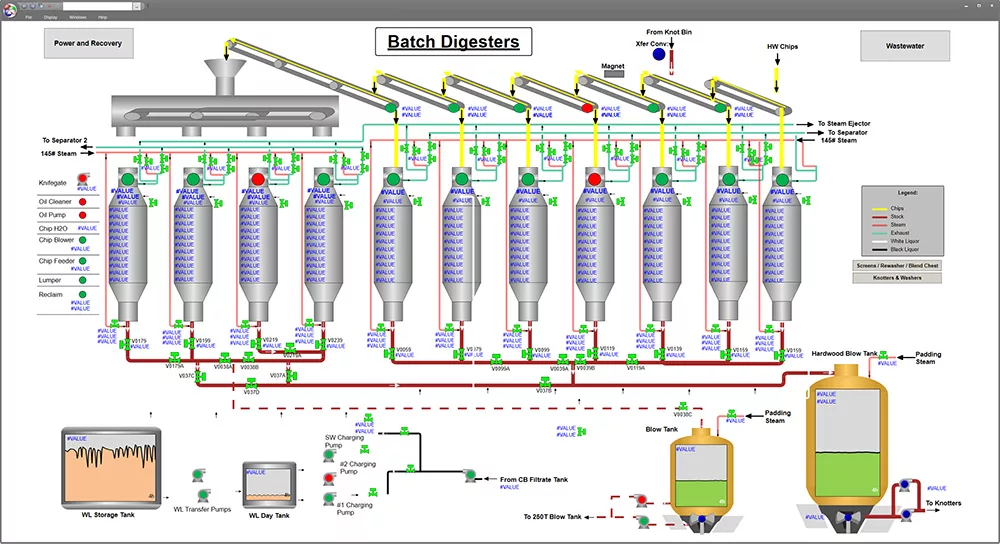
Dashboards like these are great to monitor production in real time, giving operators access to over 400 tags on one screen.
Moreover, the dashboard’s interactivity enhances its utility; operators can dig deeper into data points with just double-click in PARCview, bringing up detailed process trends.
2. Comprehensive Quality and Performance Dashboard
Lab and performance dashboards like this are vital for displaying both machine data and quality data in real-time. It is designed to enhance communication efficiency between the lab and machine operators.
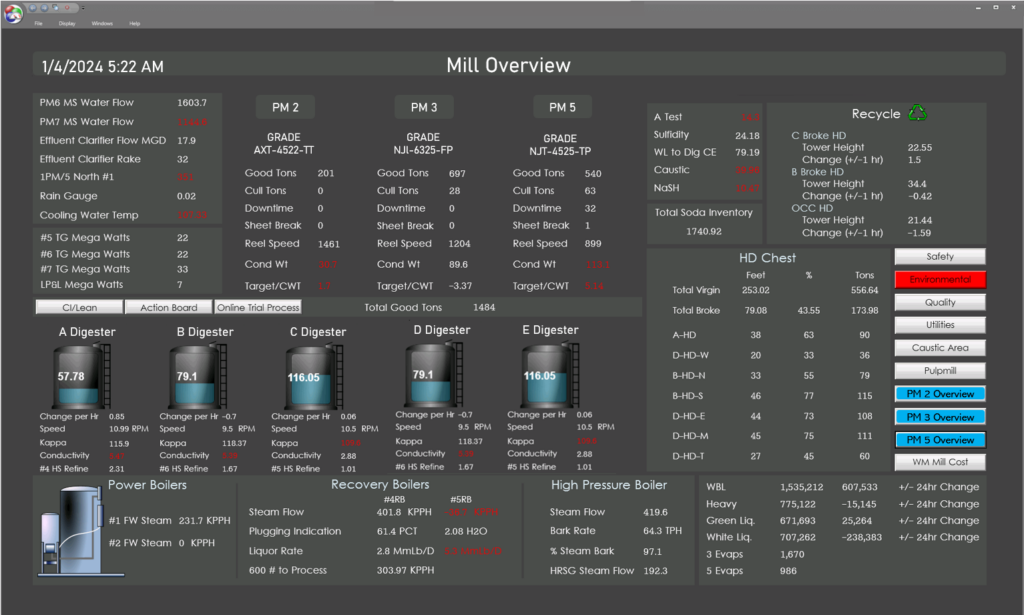
Explore the efficiency of integrating operations and quality data on a single dashboard. Real-time alerts with color-coded feedback ensure immediate response to quality deviations, enhancing operational decision-making and maintaining product integrity.
The production dashboard’s background changes color if any value falls out of the specified range, signaling an immediate alert. This visual cue provides instant feedback on quality issues, allowing operators to take corrective actions promptly without requiring direct phone communication.
3. Streamlined Monitoring: Entire Paper Machine on One Screen
This operational dashboard offers a comprehensive overview of an entire paper machine, consolidating what once required 10 to 20 DCS screens into a single 4K display.
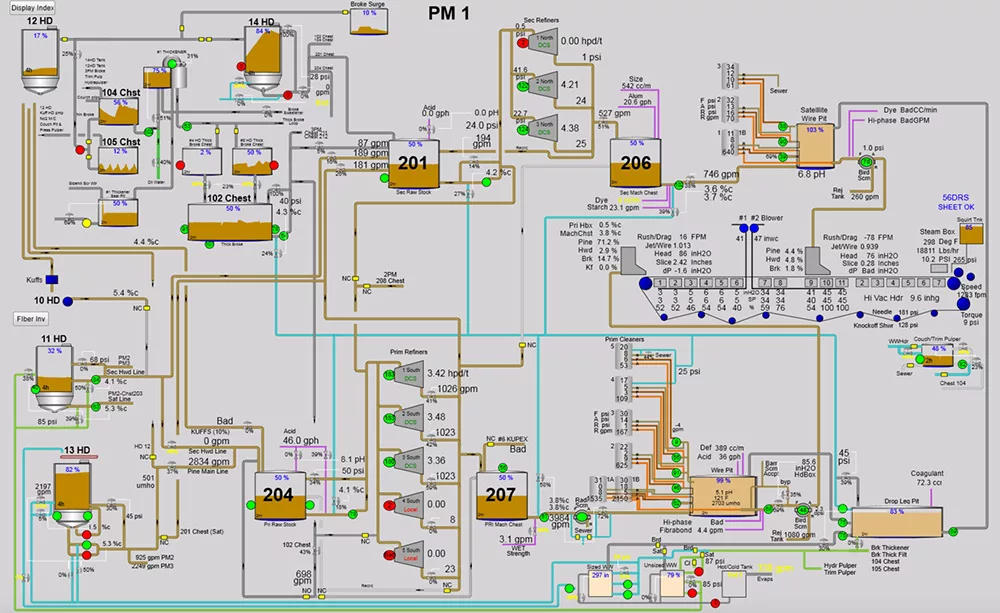
There is no need to start from scratch with to get detailed real-time graphics like this one, import and enhance existing graphics from systems like PI, IP.21 and more.
Featuring detailed representations of pipes, tanks, and the machinery itself, this dashboard is an indispensable tool for operators. Its extensive detail provides a vital resource, enabling quick assessments and direct decisions from the control room, streamlining the monitoring process and enhancing operations.
4. Power BI Downtime Tracking
This Power BI production dashboard is a performance tool specifically designed to track downtime and identify its primary causes. It demonstrates how PowerBI when properly configured and connected, can provide real-time insights into operational challenges. This capability allows maintenance teams to pinpoint and address downtime issues at a higher level.
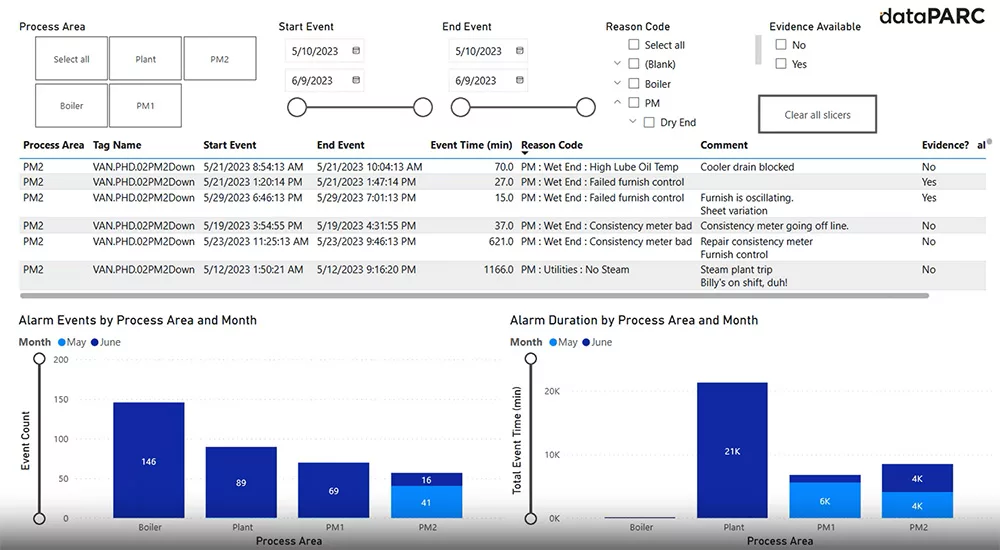
This dashboard demonstrates how dataPARC’s alarm event data seamlessly integrates into Power BI for enhanced visualization.
5. Merging Operations and Performance Insights
This hybrid dashboard integrates operational overviews with performance metrics. Enhanced with clipart and images, the dashboard presents crucial data such as operational status and performance indicators and visually guides the user for intuitive navigation.
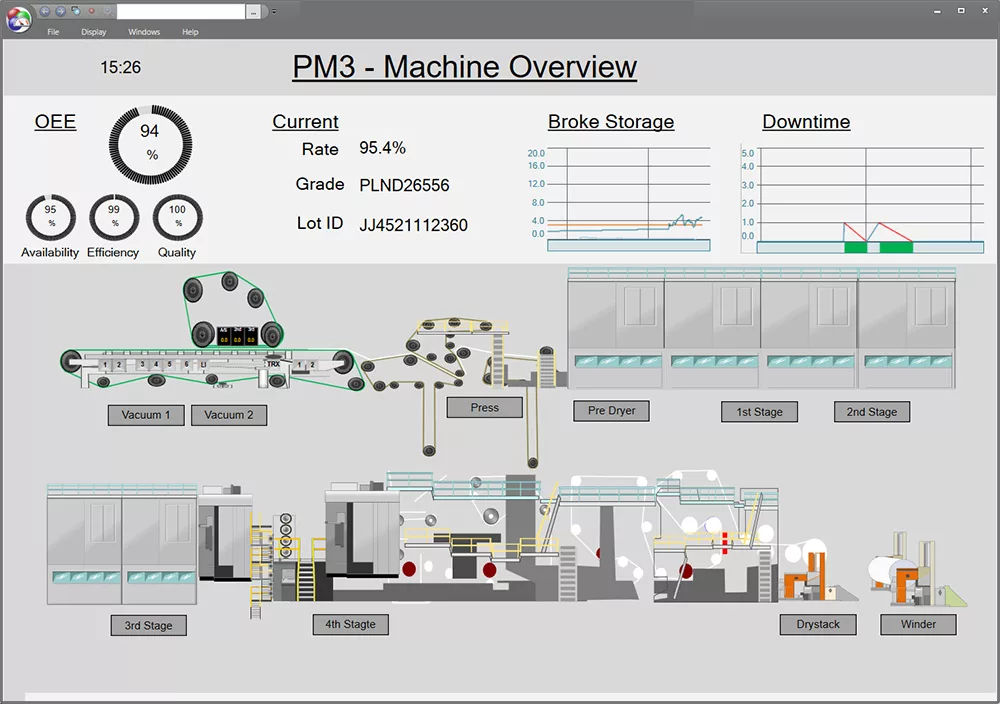
Explore deeper insights with just a click on this dataPARC dashboard. Featuring interactive trends and buttons to more pages, each element offers a gateway to further analysis and an enhanced understanding of your operational metrics.
Clickable sections allow users to dive into detailed views or additional data, providing deeper insights. This approach streamlines data accessibility and significantly improves user interaction with the dashboard, making complex information more manageable and more actionable insights.
Essentials for Developing Real-time Manufacturing Dashboards
Setting up real-time manufacturing dashboards at your site involves careful planning and consideration. The process typically unfolds in several strategic steps to ensure that the dashboards are tailored to meet your specific needs. The rollout and integration must be seamless with existing systems.
Software Selection
Selecting the right software is critical for developing effective real-time manufacturing dashboards.
dataPARC exemplifies an ideal choice as a real-time manufacturing dashboard software. It offers comprehensive data collection and robust visualization capabilities. Its tools transform complex data into clear, customizable visuals, enabling continuous monitoring of essential process variables and KPIs. This supports quick decision-making and immediate problem resolution.
Additionally, dataPARC integrates seamlessly with existing systems, providing a holistic view of operations and the ability to dynamically display data, which helps in identifying and addressing potential issues promptly. By choosing dataPARC, manufacturers equip themselves with a scalable and adaptable tool that evolves with technological and process advancements.

Build your real-time manufacturing dashboards with dataPARC’s powerful visualization tools.
Team Assembly
Assembling the right team will make or break the development and deployment of your monitoring dashboard system. It’s vital to involve individuals who have both deep knowledge of manufacturing processes and the technical skills to implement digital solutions.
Operators are particularly important due to their daily interactions with the equipment and processes being monitored. Their insights help ensure dashboards focus on relevant data and meet actual operational needs. Additionally, incorporating IT specialists, data analysts, and managerial staff into dashboard creation provides a comprehensive perspective, enhancing functionality and aligning with business objectives.
A designated leader or dashboard champion is important to drive the initiative, ensuring the project remains on track and is effectively integrated into the operational fabric of the facility, thus boosting both usability and long-term relevance.
Design Consistency
Maintaining design consistency across real-time manufacturing dashboards can help ease of use and quick data comprehension across different user roles. Establishing design standards early in the development process, covering layout, color schemes, and data presentation, helps users rapidly locate and understand key information, accelerating decision-making and easing the learning curve for new staff.
Consistency aids in quick issue identification by using uniform color codes for similar data types across all dashboards, which is crucial in urgent situations. Involving end-users in the design process and incorporating their feedback ensures the dashboards meet operational needs while remaining intuitive. This approach enhances not just individual and team performance but overall operational efficiency.
Training and Ongoing Support
Effective training and ongoing support help leverage the full potential of real-time manufacturing dashboards. Comprehensive initial training ensures users are proficient with dashboard functionality, covering data interpretation, operational responses, and troubleshooting.
dataPARC’s user-friendly interface, like PARCview, makes the learning process accessible to all users, regardless of technical skill.
Continuous education updates users on new features, enhancing their data analysis and decision-making capabilities. Support systems resolve issues promptly, maintain dashboard efficacy, and adapt to evolving manufacturing needs through regular updates and user feedback integration.

