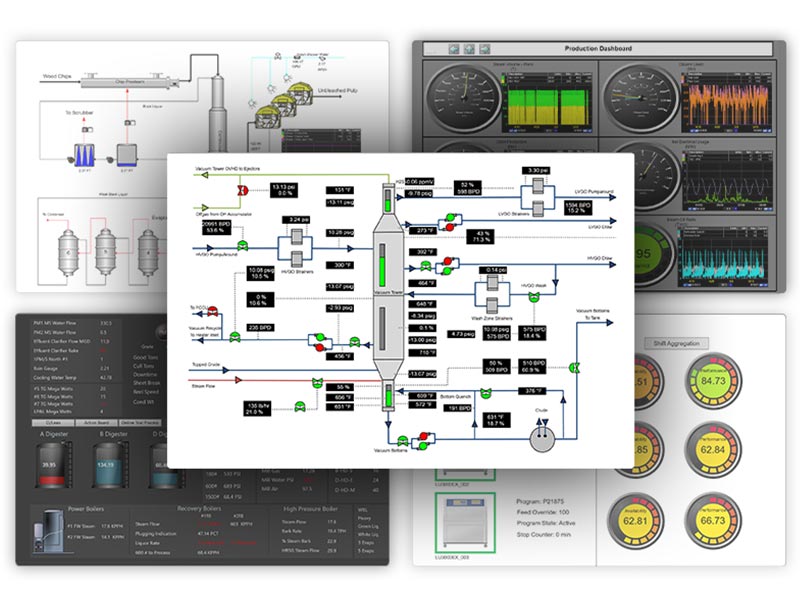
In this blog, we’ll explore how manufacturing data can be incorporated into Power BI production dashboards to give management real-time information without waiting for large data sets or monthly reports. See how dataPARC makes it easy to push data into Power BI and view your data at an enterprise level.
Gain Access to Real-Time Data to Build Effective Dashboards Powered by dataPARC
Data is something many manufacturers have an abundance of, and the challenge lies at getting condensed information to the enterprise level. There is so much data, how does the site share the right information with upper management in a fast, concise way?
Power BI has emerged as a useful tool for simplifying complexity and offering a streamlined interface that comprehends intricate data sets with ease. It is perfect for enterprise teams seeking consolidated, day-to-week views rather than real-time minutiae.
Power BI’s design facilitates swift comprehension and exploration of complex data structures. Partnered with dataPARC, it becomes a powerhouse solution, transforming raw data into visually captivating, interactive dashboards. In this connection lies a technological leap and a transformative paradigm shift in industrial operations.
For the purposes of this post, we will focus on the integration of dataPARC and Power BI. However, Power BI can connect to a variety of data sets.
Enterprise and Production Power BI Dashboards
In the relentless pace of modern business, time is currency. Swift and insightful decisions often mean the difference between staying ahead of the competition and lagging.

Delays in data analysis can be detrimental. Incomplete or outdated information leads to decisions based on assumptions rather than facts. Such decisions are akin to navigating blindfolded – uncertain, risky, and often resulting in costly mistakes.
The challenges of delayed analysis ripple across every aspect of a business – from inventory management plagued by overstocking or stockouts to marketing strategies missing the mark due to misread trends. The fallout from delayed or incomplete data analysis is not just financial; it erodes market credibility and customer trust.
Enter Power BI is the catalyst that revolutionizes data processing and analysis speed.
Power BI is a tool many Enterprises already have in their toolbox, and incorporating their manufacturing data was a matter of how it would be useful. After this, it’s safe to say it is useful and necessary.
Build Real-Time Dashboards & Displays for Effective Process Monitoring with dataPARC
dataPARC and Enterprise Data
When discussing enterprise-level decision-making, time is both a precious commodity and a decisive factor. While microscopic, real-time data is pivotal for the operational frontlines, a broader perspective is essential at the strategic helm.
The decisions made at this level demand a comprehensive overview, a panoramic snapshot of the entire landscape. However, this breadth of vision doesn’t equate to patience for sluggish data processing. This section explores how the dataPARC bridges the gap between comprehensive data and swift accessibility, enabling businesses to extract meaningful insights without compromising on time.
A Broader Perspective, Swift Results
At the enterprise level, decisions steer the ship of an entire organization. These decisions demand data, not in fractions of seconds or minutes, but in broader strokes – aggregated, comprehensive, and contextual. However, the need for breadth should never translate into tardiness. Executives require timely insights, not ponderous loading screens. The challenge lies in harmonizing these seemingly contradictory demands: broadness of data and swiftness of access.
Tiered Historian: Aggregates at Every Level
There are options for enterprise-level, cloud-based, historians that only store data aggregates. Most of the time, users at this level only need to see aggregate data, but when they do need to drill down into the data, they can access the plant level, real-time historian. Learn more about the dataPARC Historian.
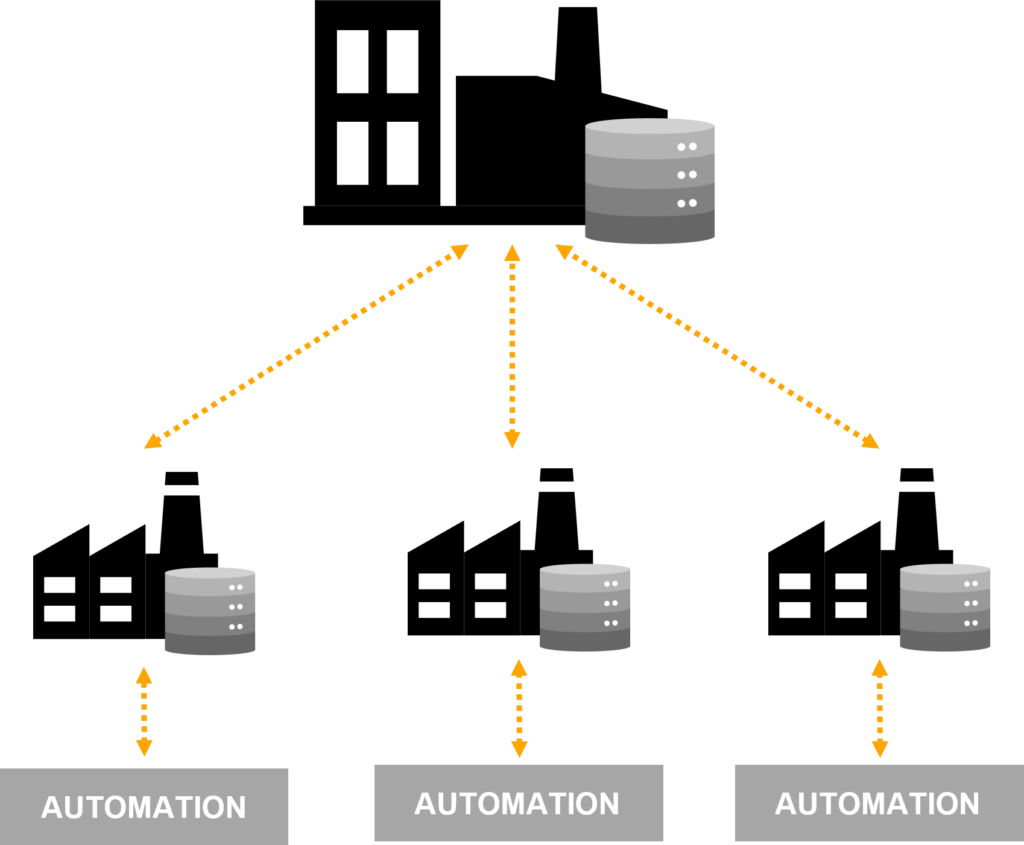
Allow users to access the data they need just like it was local. Store data on-premise, centrally, in the Cloud, or a combination of all, and maintain a seamless connection for end users.
PARCdata: Your Gateway to Timely, Comprehensive Insights
PARCdata, is the solution designed to pull process data into SQL, it acts as the bridge, connecting the intricate web of process data to the analytical prowess of Power BI. Its function is twofold: it captures the depth of process intricacies and translates them into digestible SQL format, enabling seamless integration with Power BI.
Environmental and Safety Metrics: Directly at Your Fingertips
Imagine drawing immediate insights into environmental and safety metrics, all at the click of a button. PARCdata empowers decision-makers to do just that. By aggregating process data into Power BI, environmental factors like energy consumption, emissions, and resource usage can be visualized alongside safety metrics such as incident rates and compliance adherence. This amalgamation of diverse but critical data sets paints a holistic picture, empowering executives to make decisions that are not just informed but optimized for both efficiency and safety.
Putting it all together
The beauty of the dataPARC lies not just in its ability to amalgamate data but in its timeliness. With PARCdata, the amalgamated data is not a distant promise; it’s a real-time reality. Executives don’t have to wait for periodic reports; they can access the insights they need precisely when they need them. This immediacy of access doesn’t compromise the depth of the insights; it merely accelerates the pace at which they are acquired.
Power BI Production Dashboard Demo:
Recently, dataPARC produced a webinar where an engineer walked through creating a Power BI dataPARC dashboard. Watch the webinar here, otherwise here are the highlights.
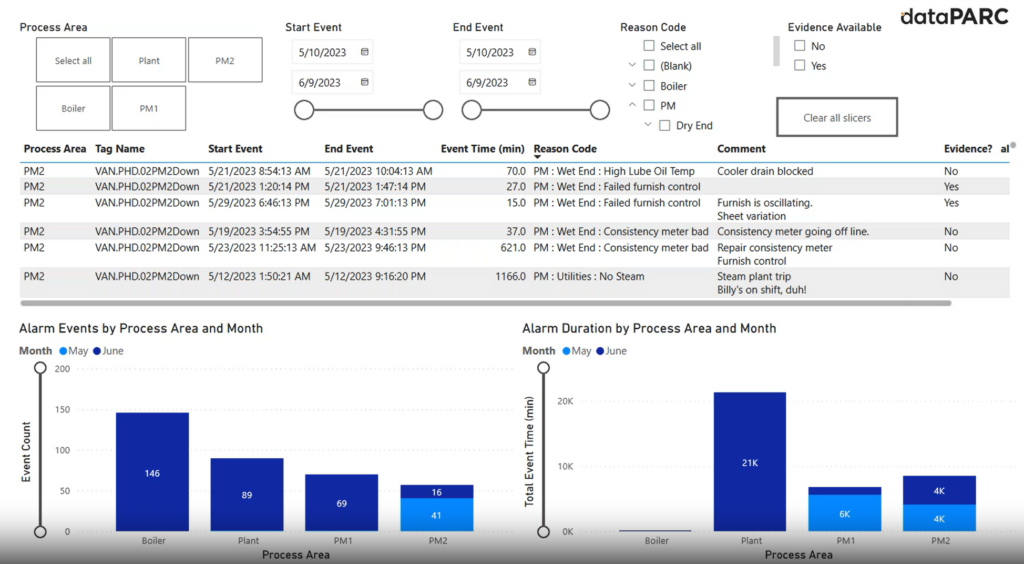
Sample alarm event Power BI dashboard created in the linked webinar.
This sample dashboard is going to take raw alarm event data and create tables and Pareto charts. This dashboard facilitated easy identification of patterns, anomalies, and trends in the manufacturing process.
Step 1 Connect to a database
Starting with Power BI Desktop, select the SQL Server Database option. Create the SQL Server database. There are two options: Import and DirectQuery.
Import – all the data is saved as a data set and will not refresh.
DirectQuery – the data will refresh but requires a gateway license.
Step 2 Select data
Write a script, or select which view, table, or function you’d like to import into the dashboard. In this case, we will pull in the alarm events view.
Step 3 Add Visuals
Insert visuals into the dashboard. Click and drag them onto the dashboard. For this example, we are using a table and Pareto charts. On the right-hand side, select the data variables and place them into the visuals.
Step 4 Add Slicers
A slicer allows users to manipulate settings when the dashboard is in use without having to change each visual individually. This could include a time range, an area or other grouping you may want to narrow the data by.
You can add multiple slicers to a dashboard. Slicers can take different forms, including checkboxes, sliding scales, or buttons. Drag the data variable fields to the slicers and select how it should display.

Mastering Manufacturing Metrics: The ultimate guide to establishing, measuring, & reporting KPIs for peak plant performance.
FAQ
Can I combine data from multiple databases within Power BI?
Yes, you can connect to multiple databases and incorporate their data within a single Power BI report. Each connection to a different database will create a separate dataset that you can use to build visuals. You can also create relationships between these datasets to enable cross-database data analysis.
Is PARCdata enabled by default in dataPARC?
Yes, PARCdata is typically installed and enabled as part of dataPARC’s installation. However, your IT department or dataPARC administrators might need to configure the service. It provides a SQL interface to access and query data within dataPARC, enhancing data analysis capabilities. As mentioned above, this allows you to access process data via a SQL query.
How do I set up auto-updating reports in Power BI?
Power BI offers a “DirectQuery” feature, which allows reports to remain connected to live data sources. You can configure a dataset to refresh at specific intervals using a gateway, which fetches the latest data from the source and updates the report. This is useful for maintaining up-to-date visuals, like displaying data for the last seven days.
Can I share Power BI reports created with the free version?
The free version of Power BI allows you to create reports, but it limits sharing and collaboration. Reports created using the free version can only be shared within your workspace, and recipients must also have access to Power BI. A Power BI Pro license is required to share reports more widely.
Conclusion
With the continuous need to process and visualize data at the speed of thought, Power BI coupled with dataPARC proved invaluable in empowering enterprises with timely, insightful, and actionable information.
The collaboration between Power BI and dataPARC didn’t just amalgamate data; it transformed it into actionable wisdom at the speed of now. Executives were no longer confined to periodic reports; they could access real-time insights precisely when needed.
This immediacy didn’t compromise the depth of the insights; instead, it empowered decision-makers with a seamless blend of breadth and speed. As we conclude this journey, it becomes evident that this collaboration isn’t merely a technological advancement but a catalyst for manufacturing excellence.