Graphical dashboards are a great way to display information to a wide audience. By building manufacturing production KPI dashboards, you can keep employees informed at every level. In this article, we will explore how to build manufacturing KPI dashboards focused on a targeted audience. At the end, we will cover some tips for building KPI dashboards and reports that are clear and easy to read.
KPIs are Key Performance Indicators measured and reviewed by manufacturers at every level of a plant. Manufacturing KPI dashboards are important visualization tools for reviewing these KPIs.
Build Real-Time Dashboards & Displays for Effective KPI Monitoring with dataPARC
Identify KPIs for Your Audience
Manufacturing KPIs often start at an organizational level and roll down to different process levels. Since KPIs can cross-department and management levels, it is not surprising that a variety of manufacturing KPI dashboards and reports are needed to provide the necessary information to each level.
When building KPI dashboards or reports that are targeted to a specific job or department, ask the following questions:
- Who is the target audience?
- What KPIs do they want to see?
- When do the KPIs need to be updated?
- Where and how will they be accessing the information?
Outlined below are three typical manufacturing levels and how they may approach looking at KPI metrics.
Understand Your End Users
Operators and Supervisors
For many operators and supervisors, their focus is to produce quality products during a shift. They cannot worry about yearly, monthly, or even weekly goals. They need to focus on what is happening in production right now.
For this reason, they want to see KPIs on a per-shift or per-day basis. More importantly, real-time data is valuable to keep production on track during the shift.
Since this group needs to see data as close to real-time as possible, manufacturing production KPI dashboards and trends are going to be the best way to communicate KPI information. Furthermore, these real-time manufacturing dashboards and trends should be integrated with the visualization of process data.
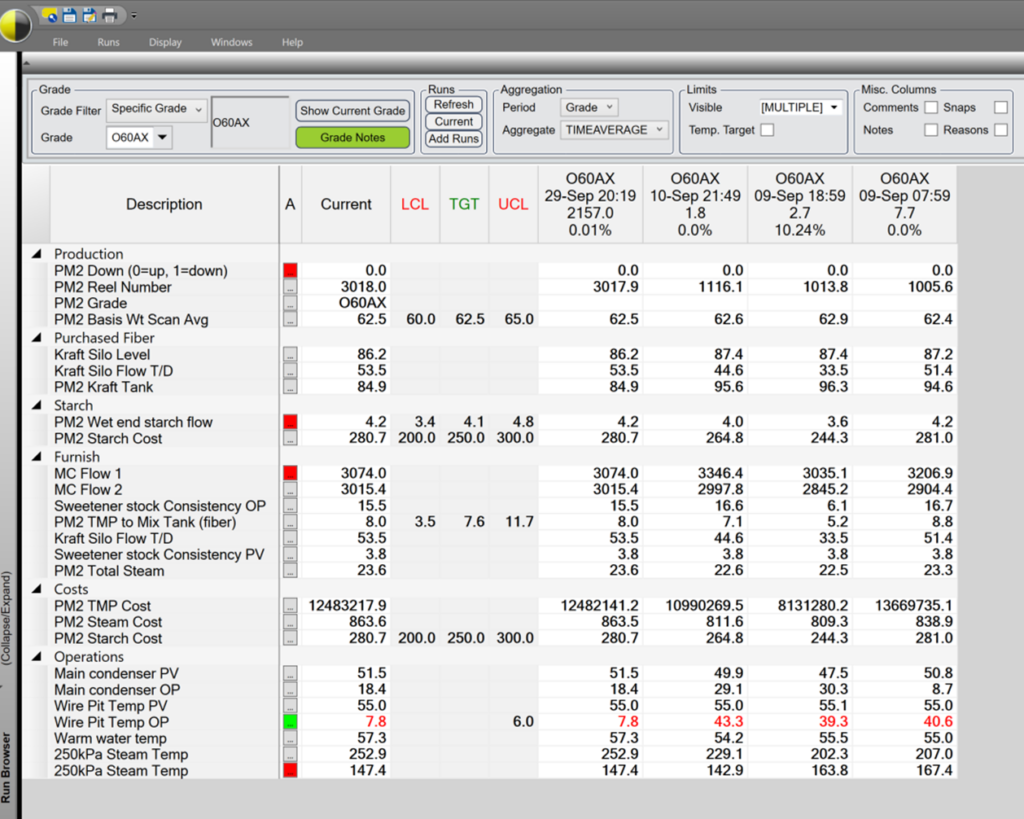
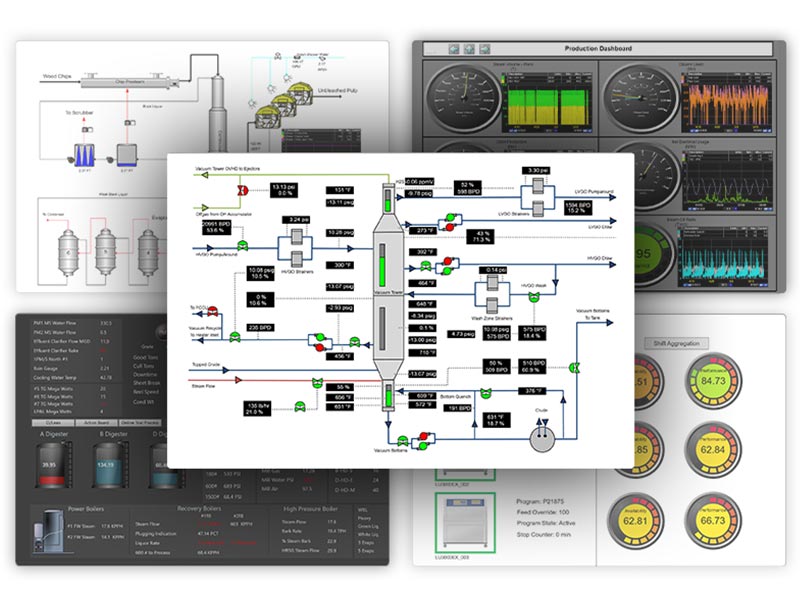
This is a Centerline display from dataPARC’s PARCview. It is a powerful tool that can be used as a manufacturing KPI dashboard. Centerlines allow operators to see aggregated process data in real-time and compare it to past runs of the same product.
Programs like dataPARC’s PARCview allow for such integration and prevent wasting time jumping from one program to another to see their operational data and KPI metrics.
- Who is the target audience? – Operators and Supervisors.
- What KPIs do they want to see? – Process-driven KPIs.
- When do the KPIs need to be updated? – By day, by shift, real-time.
- Where and how will they be accessing the information? – Data visualization software via KPI dashboards.
On the road to digital transformation? Get our Free Digital Transformation Roadmap, a step-by-step guide to achieving data-driven excellence in manufacturing.
Process Engineers and Superintendents
Engineers and Superintendents are working daily to help drive production and continuous improvement. Although they need access to real-time, shift, and daily data, they also look at longer process trends — data that focuses on weekly and monthly information.
They are responsible for helping production achieve their numbers, but also move the needle for continuous improvement. By looking at the monthly and weekly KPI metrics, supervisors and process engineers can focus their attention on certain areas.
If a shift is experiencing increased changeover, a supervisor might not see it as an issue that affects other shifts. They could think it was a slow day, which only affected their shift. By being able to see the daily and weekly values, the gradual trend of increasing change over time will be caught much faster. Allowing for a deeper dive into the process data to see what was causing everyone to increase their changeover time.
Manufacturing production KPI dashboards are a good way for process engineers and superintendents to see some values, but they are not in front of the monitors all day.
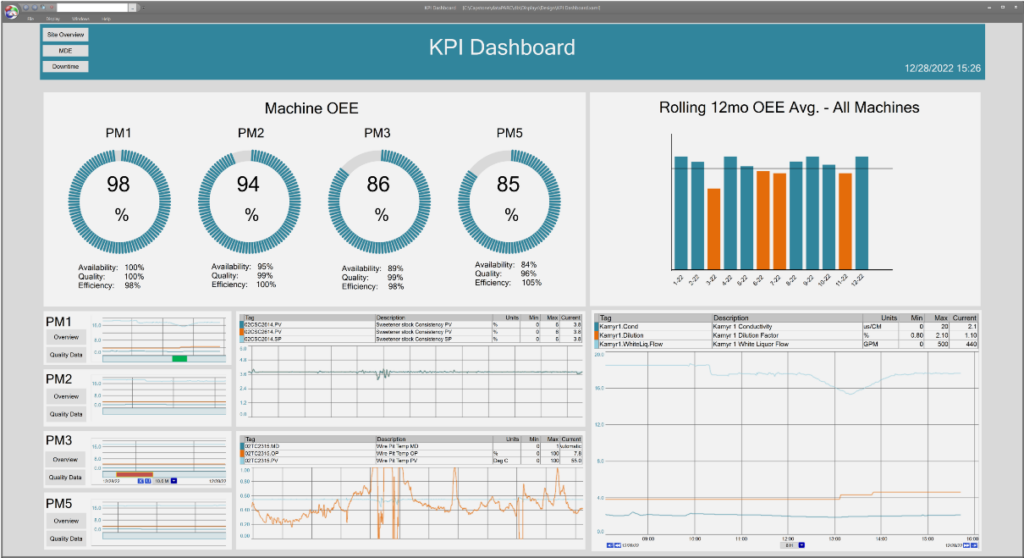
This overview KPI dashboard is a good resource for engineers and superintendents. It shows KPIs at a high level for each machine, with the ability to dive into certain process areas as needed.
KPI reporting via email can fill the gap. This puts information directly in front of engineers and superintendents. Events can trigger KPI reports. When users receive such a report, they know something is wrong, and they need to look into the information right away.
- Who is the target audience? – Engineers and Superintendents.
- What KPIs do they want to see? – Process-driven KPIs and Continuous improvement KPIs
- When do the KPIs need to be updated? – By month, By week, by day, real-time.
- Where and How will they be accessing the information? –KPI Dashboards via Data visualization software, Automated Reporting via Emails/Reporting software.
Management / Upper Management
Often, KPIs start with upper management and roll down. Upper management wants to see everything, but not in as much detail as operations or engineers.
They want to see the process-driven and continuous improvement KPIs aggregated on a monthly or yearly basis. Management has an interest in employee and customer KPIs, such as overtime rate or customer product returns. These types of KPIs also affect the bottom line and are important for management to keep track of.
Since management does not tend to dive into the raw data frequently, manufacturing KPI dashboards are often not as necessary as KPI reports or even presentations for meetings.
KPI reports can be created with data visualization software, although reports are often emailed rather than saved in the program for faster access.
For consistency in KPI reporting, some manual data manipulation could be necessary, depending on how exactly the group chooses to view the data.
- Who is the target audience? – Upper Management.
- What KPIs do they want to see? – Process-driven KPIs, Continuous Improvement KPIs, Employee and Customer KPIs
- When do the KPIs need to be updated? – by month, by year
- Where and how will they be accessing the information? – Automated Reporting via Emails/Reporting software and PowerPoints via manually created displays for meetings.

Mastering Manufacturing Metrics: The ultimate guide to establishing, measuring, & reporting KPIs for peak plant performance.
Design Manufacturing KPI Dashboards for Maximum Impact
The creation of manufacturing KPI dashboards and KPI reports are often left up to engineers or other process employees, sometimes having little design training. Here are a few tips when building KPI Dashboards and KPI reports.
Visual Accessibility
Visual accessibility through color and font size can make or break a manufacturing production KPI dashboard or report. Color blindness is common, and using colors that many people cannot differentiate between could make your dashboard ineffective. Try using symbols instead of or in addition to colors to make your point.
Even those without color blindness can have difficulty reading text on a low-contrast background. This affects both KPI dashboards and KPI reports.
There are websites where you can upload an image and give a score on the legibility of the text contrast. Some websites show how images are perceived by those with different types of color blindness. Before finalizing a KPI dashboard or KPI report, upload an image to these sites and confirm it is legible to all.
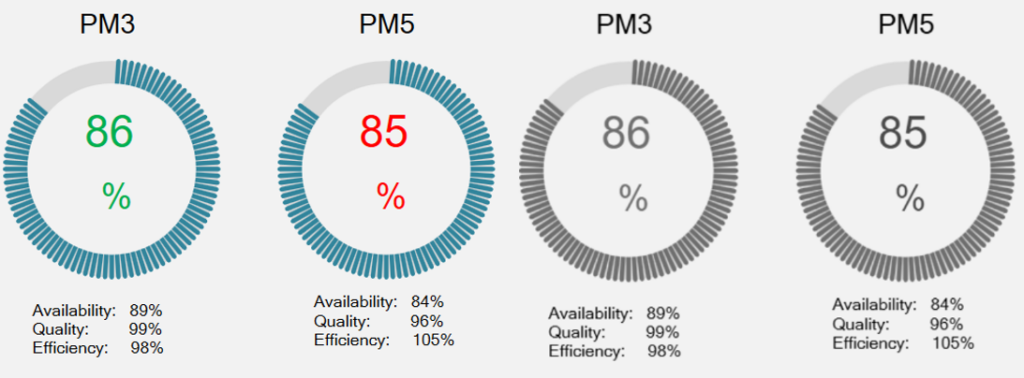
The first two dials have green and red text to indicate whether the values are ok. However, someone who can only see in a monochromatic view cannot distinguish between the green and red shades. Alternatively, when building manufacturing KPI dashboards, use a line or other indication to show when something is ok or needs attention.
In terms of font size, consider the location of the dashboard display. Most programs allow users to zoom in on displays. However, if a manufacturing production KPI dashboard is on a TV screen on the plant floor, users may be unable to interact with the display. Then, they might not be able to see the important information and metrics.
Information Layout
When creating a manufacturing KPI dashboard for an operator workstation, the layout can be impacted if the operator notices certain information.
For dashboards and reports, people tend to read from top to bottom and left to right. The most important information should be in the upper right corner of a display, with the least critical values in the bottom right.
However, the location of the dashboard on the screen should also be considered, not just the dashboard itself.
If an operator workstation has multiple monitors, consider where the KPI dashboard is going to sit on the screen. If a KPI dashboard is going to be off to the upper right, out of the immediate line of sight of the operator, the most important information should then be in the bottom left corner. Moving to the bottom right, then top left and right as you move down the list of importance.
Some programs allow start-up displays to be configured and their location, which can help put screens where they are designed to be.
KPI Dashboard Navigation
Manufacturing KPI dashboards are often open during each shift to make sure daily production is on track.
By including buttons to navigate to different dashboards and trends, users have a jumping-off point for troubleshooting when something goes awry in production.
When using navigation buttons, make sure they are clearly labeled and in the same location on each dashboard.
Layout Consistency
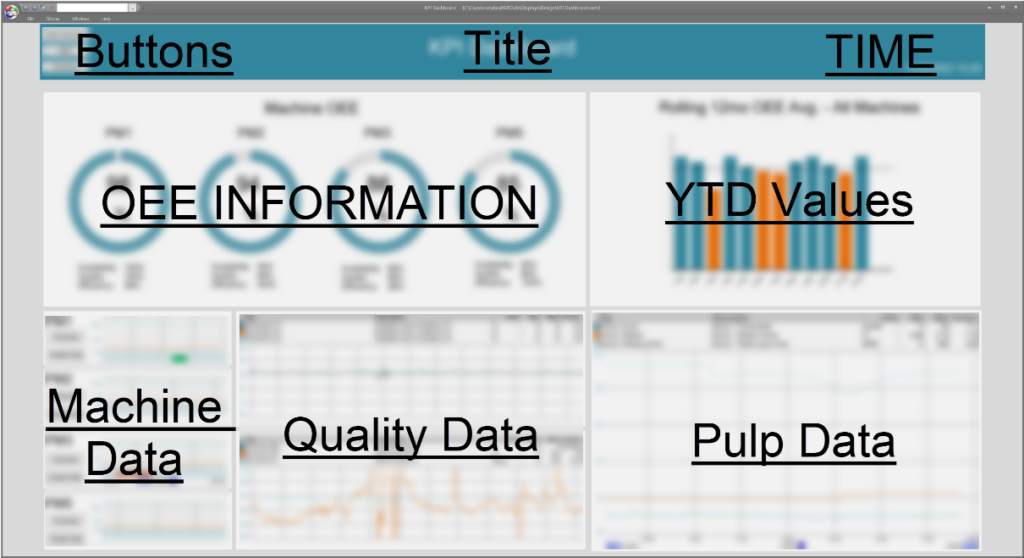
Choose zones that can be consistent from the dashboard to the dashboard, such as buttons, titles, time, and past data aggregates.
Come up with a standard layout for KPI dashboards and KPI reports. Creating a consistent layout for buttons, data, key production information, etc. on KPI dashboards and reports will allow users to find answers more quickly.
This will also make it easy for someone coming from another machine or department to find the information they are looking for quickly.
Manufacturing KPI dashboards and reports can be a powerful tool for companies to see where they are in comparison to their targets. When building new manufacturing KPI dashboards and reports, make sure to identify the audience, pay attention to color and font size, and keep a consistent layout.
FAQ: Building Manufacturing KPI Dashboards
- What is a Manufacturing KPI Dashboard?
A visual tool that displays key metrics related to manufacturing performance, helping teams monitor operations in real time and make data-driven decisions. - Why are KPI dashboards important in Manufacturing?
They consolidate complex data into a clear format, helping reduce downtime, improve efficiency, and align operations with business goals. - What KPIs should I include on a manufacturing dashboard?
It depends on your audience, but common ones include OEE, downtime, yield, throughput, quality rate, and on-time delivery. - What’s the best way to lay out a KPI dashboard?
The most important information should be placed in the top left, as that is where the eye is drawn. Follow a right-to-left, top-down approach (or however your country’s reading pattern goes). Try to keep like metrics grouped and avoid clutter. - How often should dashboards update?
Real-time data is ideal for operations. For executive dashboards, daily or less frequent updates could be adequate. - What are common dashboard design mistakes?
Overloading dashboards with too much irrelevant or low-priority information is one of the most common mistakes. It creates visual noise and makes it harder for users to focus on what matters. Another issue is inconsistent layout across dashboards, which forces users to relearn navigation or hunt for metrics, slowing down decision-making and reducing usability.
Mastering Manufacturing Metrics
The Ultimate Guide to Establishing, Measuring, & Reporting KPIs for Peak Plant Performance