KPIs are a powerful tool for manufacturers to drive continuous improvement and promote process efficiency. We’ll explain what KPIs are, how they are used in manufacturing and tie into continuous improvement. Feel confident in selecting and developing KPIs with a step-by-step outline.
Build Real-Time Dashboards & Displays for Effective KPI Monitoring with dataPARC
What are KPIs?
KPI stands for Key Performance Indicators. These are metrics that a company deems necessary to monitor performance, analyze and improve the process. These variables are measured by each department and reviewed on a regular basis.
It is not enough to measure KPIs, they also need a target. More specifically, the target should be SMART – Specific, Measurable, Achievable, Realistic and Time-bound.

KPIs and their targets are often tracked with a simple chart. The target line provides a clear and visual marker of performance. KPIs with SMART targets point to areas that are underperforming and could use a focused project to get back on track.
How are KPIs used in manufacturing?
KPIs are used across industries, from banking and retail to manufacturing and travel. In manufacturing, KPIs are used to drive process improvements and reduce costs. Manufacturing KPIs often start from the top with the company goals and are broken down to department level KPIs.
Even though departments are working toward the same overall goal, they could have varying ways to achieve it, thus having different KPIs.
Since KPIs roll up to an organizational level, they can be used to keep the teams and departments on track, moving towards the company’s goals. By breaking down the company goal into departments, it turns a single lofty target into actionable and manageable ones.
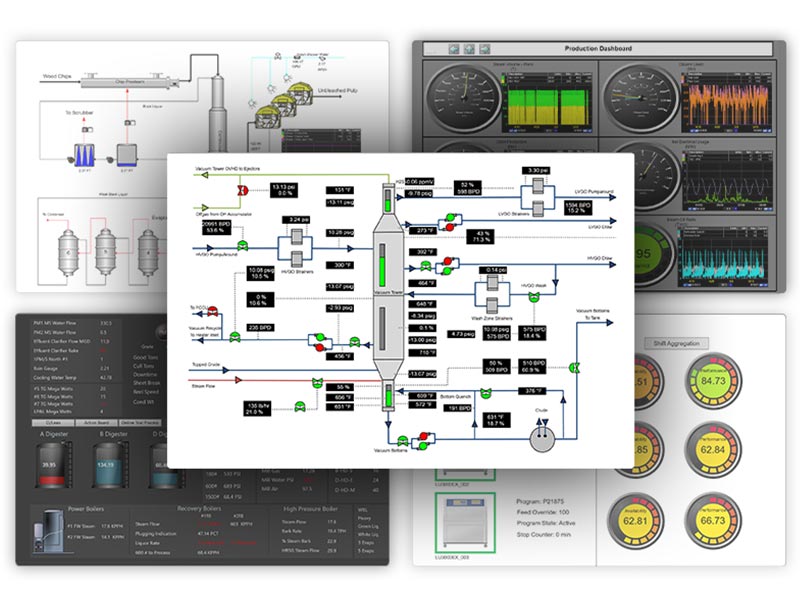
Manufacturers regularly use KPI trends or dashboards for everyone can see and understand their current performance.
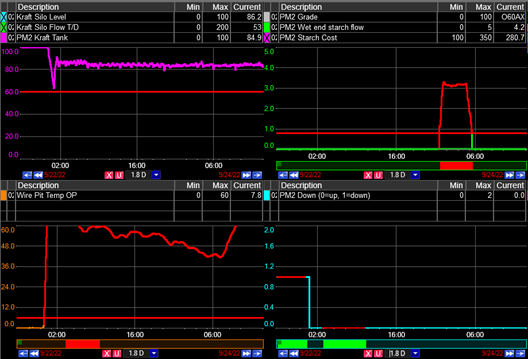
Real-time manufacturing analytics software is used to view downtime and alarms during production.
A manufacturing KPI dashboard can be reviewed on a daily or weekly basis. When daily operations are on track, then monthly and yearly goals will be met. By reviewing manufacturing KPIs on a regular basis, operations can quickly identify drops in performance as they happen, rather than after the fact.
Manufacturing Process KPIs & Continuous Improvement
Manufacturing KPIs and metrics go hand in hand with continuous improvement. To improve, we need to measure the current performance and have a target for the future. Continuous improvement initiatives are focused around KPIs, even if that is not how it is proposed.
KPIs naturally drive continuous improvement. When people see a value drop, it is intuitive to want to get it back up. Clear measures with targets reviewed on a regular basis help get the team on the same page. From upper management to operators, everyone knows what the goal is and the current performance.
KPIs promote data-driven decisions. If a manufacturing KPI is struggling, it will point operations to make an adjustment sooner because the data is showing something is off.
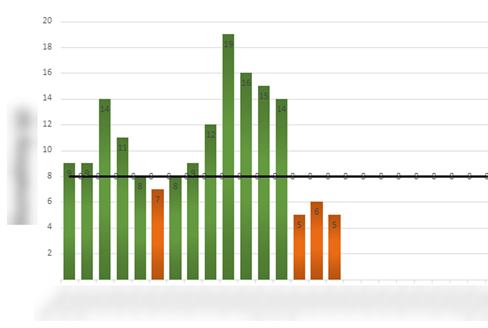
This simple manufacturing KPI bar chart has a target to clearly identify when the target is not reached.
KPIs provide evidence that a change is needed, rather than going off someone “having a feeling” that something is wrong. When a KPI chart drops, engineers and operators can investigate the issue right away and be confident in their course of action. The evidence is there.
Finally, KPIs hold the team accountable for the goals that were made at the beginning of the year. It gives them something to strive toward. If a target was not achieved, the owner of the KPI will have to answer to it and discuss the reasons. This could lead to more or better tracking of (downtime) reasons, or causes. Meaning the team has even more data. Which in turn will give the team better information to improve the process and hit the manufacturing KPI next time.
Selecting & Developing Manufacturing KPIs
With so many variables, departments, and industries out there, it can seem overwhelming to determine which KPIs should be tracked and how to get started.
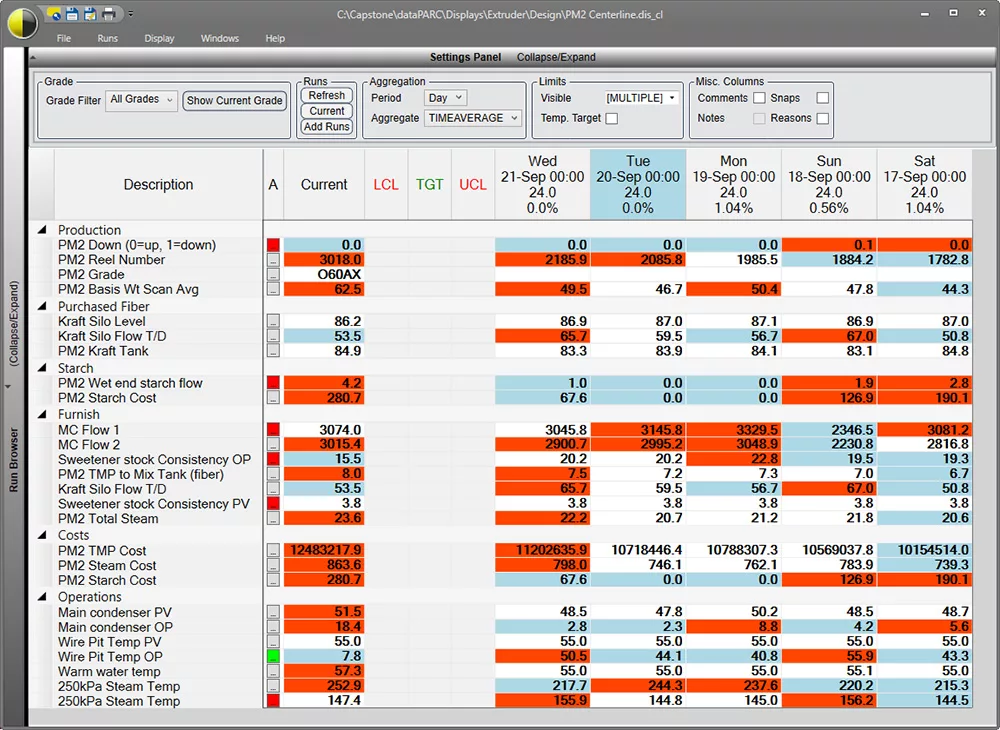
This display showcases KPIs by run in a clear, tabular format. Ideal for tracking consistency and performance across different periods, ensuring effective continuous improvement and strategic planning.
It is important to start small and not try to rack tens or hundreds of manufacturing KPIs right off bat.
The type of manufacturing plant will dictate which KPIs need to be measured, although there are some common KPIs that span industries. Here are a few steps on how to get started
1. Create A List Of Possible KPIs To Track.
To help create a list of possible KPIs to use at your manufacturing company start by breaking in down into categories. Categories of Value to Customer, Value to Company and Value to Employee are good starting points to help narrow down the options and get a list flowing.
Example of Value to Customer – Focus on KPIs that directly impact customer satisfaction and retention, such as On-Time Delivery, Throughput, and Quality of Products. These indicators reflect how well the manufacturing process meets customer expectations and demands.
Examples of Value to Company – This category should include KPIs that affect the bottom line and operational efficiency, such as Waste Reduction (material, time, money), Overall Equipment Efficiency (OEE), Production Downtime, and First Pass Yield. These metrics help pinpoint areas where process improvements can reduce costs and increase profitability.
Examples of Value to Employee – Consider KPIs that ensure a safe and conducive work environment. These may include measures of Safety Incidents, Automation Levels, and Ergonomic Conditions. Enhancing these areas not only supports employee well-being but also boosts morale and productivity.
Another approach to consider is leading vs. lagging indicators of performance. A lagging measure reflects past performance. A leading measure will reflect the status on process and practices. Leading indicators are anticipative in nature and can be used to drive future performance.
For examples of common lean manufacturing KPIs to track, the following section has 13 top metrics outlined!
2. Narrow Down KPIs
When starting out with KPIs, it’s essential to narrow down the initial list to a manageable few that provide clear insights. Begin by choosing the top one or two KPIs from each category—Value to Customer, Company, and Employee—ensuring a balanced approach to performance measurement across your operations.
Include both leading and lagging indicators to capture a full spectrum of performance metrics. This allows for both retrospective analysis and forward-looking strategies. KPIs must be simple and understandable; overly complex metrics can be difficult to track and are less likely to be adopted consistently across departments.
After selecting your KPIs, consider a trial period to evaluate their effectiveness and make adjustments as necessary. This process ensures that the KPIs you finalize are not only relevant but also practical and beneficial for enhancing operational efficiency and supporting continuous improvement.
3. Determine How To Measure Each KPI
Next, determine how these variables can be measured. Focus on KPIs that can be tracked automatically and frequently, such as per minute or per hour, as these provide real-time data that can facilitate swift adjustments and improvements. Frequent measurement ensures accuracy, it also helps maintain the momentum of continuous improvement efforts by providing immediate feedback.
On the other hand, if a KPI is challenging to measure due to the complexity of data collection or the lack of suitable technology, it may not be the ideal choice. Especially for the initial implementation phases.
Starting with KPIs that are straightforward to track will help build a strong foundation for your metrics system. For additional guidance on how to measure KPIs effectively, including data collection methods, relevant examples, and detailed formulas, check out Manufacturing KPI Formulas: 10 Formulas for Measuring Success. This resource will provide deeper insights into establishing a framework for KPI tracking that aligns with your manufacturing goals.

4. Choose Targets
Create a SMART goal and target for each manufacturing KPI. SMART goals are Specific, Measurable, Achievable, Realistic, and Time-bound. This provides a structured approach that facilitates easier management and assessment of progress. For instance, rather than setting a vague objective such as “Reduce Downtime,” specify the target by stating, “Reduce downtime on Machine 7 by 5% by January.”
This type of goal not only defines the exact expectation but also includes a specific machine and a deadline, which helps in focusing efforts and resources effectively.Moreover, creating SMART targets helps in aligning the KPIs with the overall business objectives, making it easier for team members to understand their contributions towards achieving these goals.
It encourages a focused approach to problem-solving, where team members can devise strategies and interventions that are directly linked to improving specific metrics within a set timeframe. By establishing clear, quantifiable, and achievable targets, you set up your team for success and create a pathway for continuous operational improvement.
5. Establish Reviewing & Reporting
Establishing an effective review and reporting mechanism is a critical step in managing manufacturing KPIs effectively. Deciding on the tools and methods to track manufacturing kpis can significantly impact how actionable your insights are. Utilizing real-time data dashboards, like dataPARC, can offer immediate feedback and allow for quick adjustments. Alternatively, traditional methods such as spreadsheets and charts can also be effective, especially when combined with more sophisticated reporting tools.
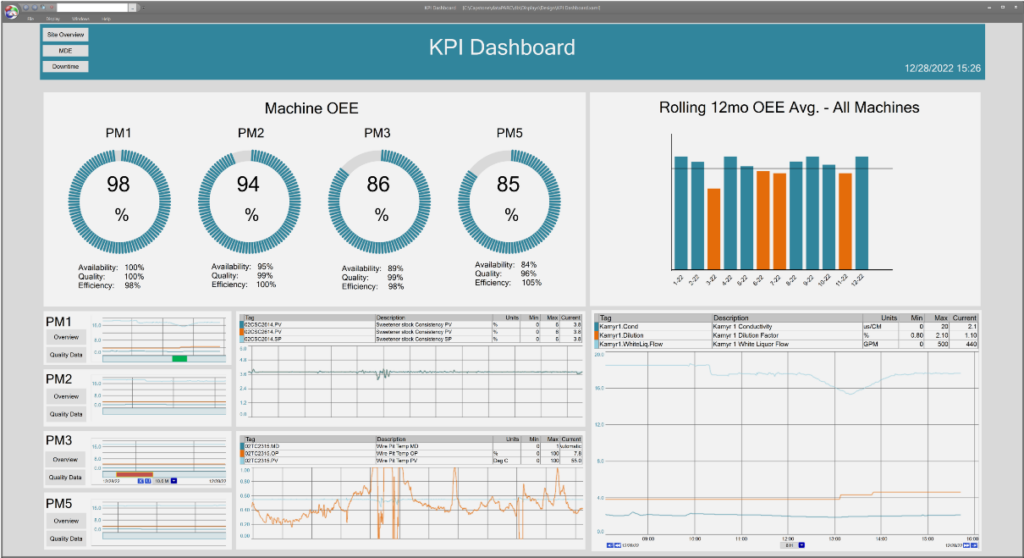
Manufacturing KPI dashboards are a great way to display and report these important metrics. This dashboard shows each machines OEE and has buttons leading to relevant pages.
It’s important to recognize that KPIs are not static; they should be periodically reviewed to ensure they continue to add value to your operations. This regular reassessment helps in refining your focus, adjusting goals as operational conditions change, and ensuring that the KPIs remain aligned with your strategic objectives. As your team grows more accustomed to the process of continuous monitoring and improvement, you can gradually expand your KPI framework to include additional metrics.
Starting with a small set of high-impact KPIs is advisable. Concentrate on those metrics that directly influence critical success factors or pain points in your manufacturing process. This approach helps in maintaining a manageable scope, ensuring meaningful engagement with the data, and facilitating targeted improvements that can yield significant benefits swiftly. As your operations evolve, so should your KPIs, adapting to new challenges and opportunities in the manufacturing landscape.
13 Top Manufacturing (KPIs) Key Performance Indicators Worth Tracking
Key Performance Indicators are essential tools that vary across different sectors of the manufacturing industry. However, there are many that are common and crucial for assessing the efficiency and productivity of any manufacturing operation.
While typical lists of KPIs may offer only a brief overview of the metric and its calculation formula, this section aims to provide a more comprehensive understanding. Here, we will explore not only how to measure each manufacturing KPI accurately but also how to establish meaningful, achievable targets and effective reporting mechanisms.
Our goal is to ensure that these metrics aren’t just numbers but powerful tools for continuous improvement, enabling manufacturers to optimize operations, enhance productivity, and ultimately drive growth. This deeper approach to understanding KPIs will equip you with the knowledge to implement them effectively within your own operational strategies.

Mastering Manufacturing Metrics: The ultimate guide to establishing, measuring, & reporting KPIs for peak plant performance.
1. Changeover Time
Changeover time refers to the duration required to switch a manufacturing line or machine from producing one product to another. Minimizing this time is crucial as it directly impacts production efficiency by reducing downtime and increasing machine availability.
To effectively measure changeover time, it’s important to clearly define the start and end points of a changeover in operational terms, ensuring consistency in data collection. Setting a realistic target for changeover time should consider historical performance data, aiming for continual improvement. Establishing regular reporting on this KPI will help track progress toward the target and identify opportunities for process optimization.
Effective tracking and improvement of changeover times can lead to significant enhancements in overall throughput and operational flexibility.
2. Production Volume
Production volume refers to the total quantity of products manufactured or processed in a specific period. This metric is used to measure the output levels of production operations, often expressed in units, batches, or mass.
To measure Production Volume, it’s crucial to define the specific output quantities per shift, day, or product line, depending on the operational scale and needs. For determining a target, analyze historical production data, consider capacity utilization constraints, and aligning with strategic business objectives and goals to ensure it’s both realistic and challenging. Production volume can be dispalyed on dashboards using visualization tools that provide real-time insights and trends. This enabling timely adjustments and transparent communication.
3. OEE (Overall Equipment Effectiveness)
Overall Equipment Effectiveness (OEE) is a comprehensive manufacturing KPI that measures the efficiency and utilization of manufacturing equipment, integrating aspects of quality, performance, and availability.
To accurately measure OEE, collect data on the actual operating time versus planned production time, along with information on the quality of the items produced. Establishing a target for OEE should consider industry benchmarks and historical production performance to set realistic goals for improvement. Viewing OEE on a dashboard or in reports provides insights into production efficiencies. It also gives potential areas for enhancement, enabling continuous process optimization.
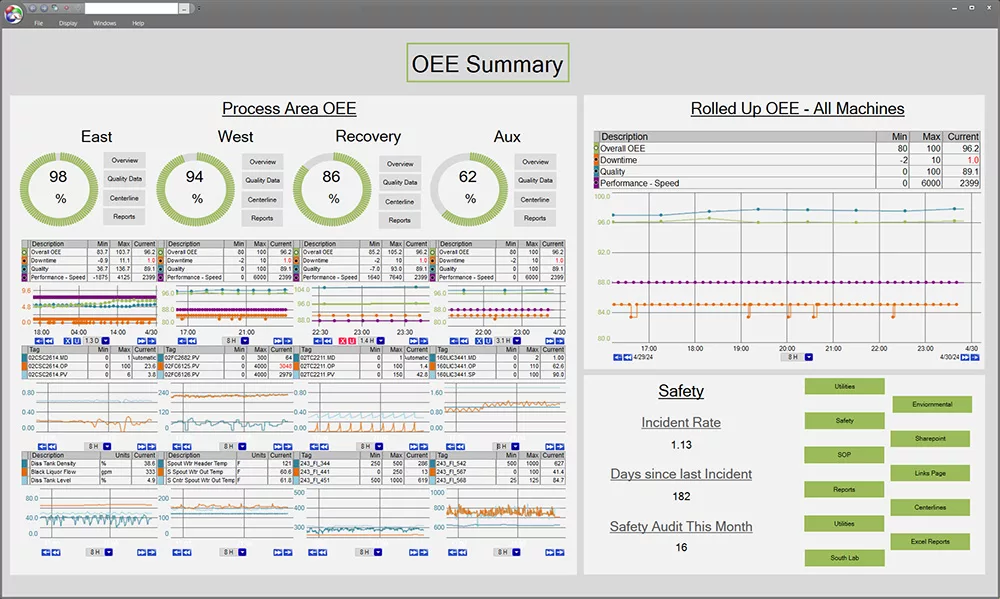
Monitor OEE across the site in one place. This dashboard provides crucial insights into productivity, helping identify areas for improvement and ensure optimal machine performance across your manufacturing operations.
Understanding OEE helps pinpoint areas for improvement in machine usage and maintenance practices.
4. Maintenance Costs
Maintenance costs as a KPI track the expenses associated with keeping machinery and equipment in optimal working condition. Measuring this KPI, requires all costs related to maintenance activities, including labor, materials, and any external services.
Setting a target for maintenance costs companies must look at past expenditures, future expectations as well as industry standards to define a cost-effective yet realistic budget. They want to ensure operational efficiency without compromising equipment performance. Establishing routine reporting on maintenance costs helps identify trends and potential areas for cost reduction, aiding in strategic decision-making for resource allocation and preventive maintenance scheduling.
5. Thoughtput
Throughput measures the amount of product produced over a specific period. To accurately gauge this KPI, track the quantity of output generated by a machine, production line, or plant within a given time frame. Set targets for throughput by evaluating historical performance data, capacity limits, and operational goals to establish ambitious yet attainable benchmarks.
Throughput can be reported using a varity of tools including dashboards, trends and reports. Such information can provide productivity trends and can help pinpoint operational bottlenecks, guiding timely adjustments to enhance production flow and meet planned targets.
High throughput rates often reflect well-optimized production equipment and processes, while fluctuations can signal issues in the production line that need addressing.
6. On Time Delivery
On-time delivery measures the rate at which completed goods are delivered to customers by the promised date. It’s a critical metric for customer satisfaction and can significantly impact the reputation and reliability of a manufacturing operation.
Reporting tools support on-time delivery by enabling routine, event-triggered, and on-demand report generation. This flexibility ensures timely updates and supports proactive management of delivery schedules.
To accurately measure the On-Time Delivery track the percentage of orders delivered by the promised date over a specified period. A realistic target would be based on historical data and goals to improve delivery performance incrementally. Reporting for this metric might look like regular emailed reports to key stakeholders.
7. Production Cost Per Unit
This KPI calculates the total cost involved in producing a single unit of product. To calculate the cost per unit, gather all components of total production costs, including materials, labor, and overhead, and divide by the number of units produced in a specific period.
Establishing a target for this KPI involves analyzing historical data and internal cost-saving goals to set realistic yet challenging cost objectives. Regularly report this manufacturing KPI on dashboards and Monthly Operational Reviews (MOR) to track progress towards reducing unit costs, optimizing resource allocation, and enhancing profitability. Keeping this metric front and center will ensure it aligns with the strategic financial goals of your site.
Lowering the production cost per unit is a direct way to enhance profitability.
8. Unit Costs
Unit costs track the expense incurred in creating each unit of product, similar to production cost per unit but often segmented by different cost types such as materials and labor.
To measure the Unit Costs, it’s important to capture all variable and fixed costs associated with the production process on a per-unit basis. You need to consolidate this data in a central location for further calculation. Setting a target for this KPI requires a thorough understanding of production economics and market conditions, aiming for a cost that sustains profitability while remaining competitive.
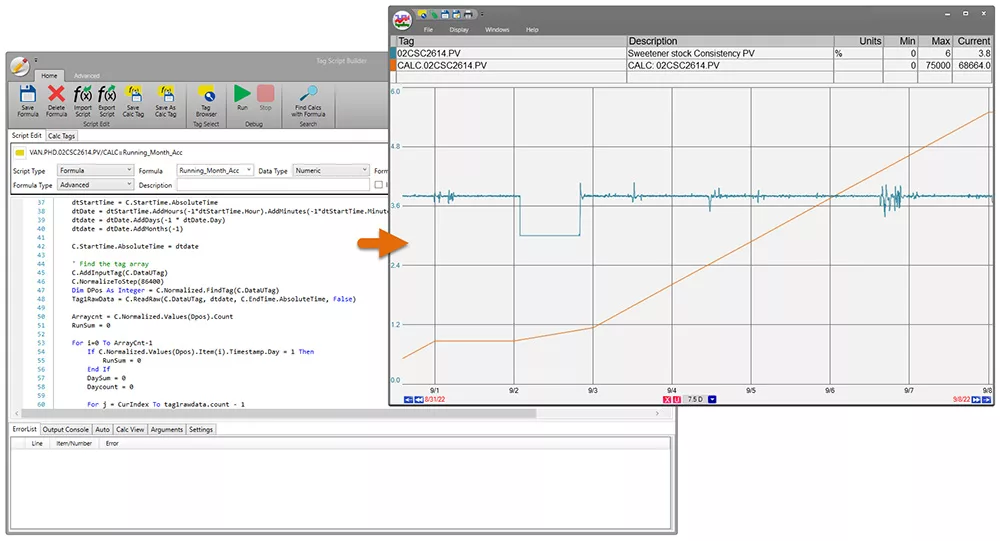
Integrate calculations like unit costs with real-time process data in a single platform, enabling visualization alongside relevant operational trends for comprehensive analysis.
Unit Cost can be calculated in real-time as shown above. It can also be included in monthly and quarterly reports. These results will help gain insights that highlight opportunities for cost optimization and efficient resource use.
9. Customer Satisfaction
Customer satisfaction measures how products meet or exceed customer expectations. Quality, delivery time, and product performance all play a role.
A Customer Satisfaction KPI is not as real-time or frequent as some of the other metrics and may take some creative strategies for sourcing data. Consider utilizing surveys, customer feedback, and service quality assessments. Targets are set based upon historical performance with an aim for continual improvement.
Reviewing and reporting customer satisfaction doesn’t always get back to the manufacturing team, but it should. Positive feedback is motivating and constructive feedback points out areas needing attention.
High satisfaction and customer demand levels are often indicative of effective manufacturing and quality control processes.
10. Production Lead Time to Customer
This KPI tracks the time taken from receiving a customer order to the delivery of the product. Reducing production lead time improves customer satisfaction and can give a competitive advantage by enabling quicker order fulfillment.
To measure, use a timestamp system to log each phase of the production and shipping process. This is most likely already happening in your process. The data needs to be extracted and calculated. Choose a target by analyzing past performance data and set achievable goals for reducing lead times. Reporting can be on operations dashboards, even leading to a little friendly shift to shift competition on reducing lead times.
11. Actual Production Time
Actual production time refers to the total time that machines and equipment are actively producing goods.
Monitor the time machines or production lines are actively manufacturing products, excluding any setup, maintenance, or downtime. If you are utilizing downtime tracking within software this is a great place to start. Establish a target that aims for maximum efficiency based on historical performance, ensuring it is realistic and achievable within a specified timeframe. Set up a regular reporting system that highlights variations from the target. This can be an emailed report to managers or an always-up dashboard for production. These timely interventions optimize production schedules and maintain operational efficiency.
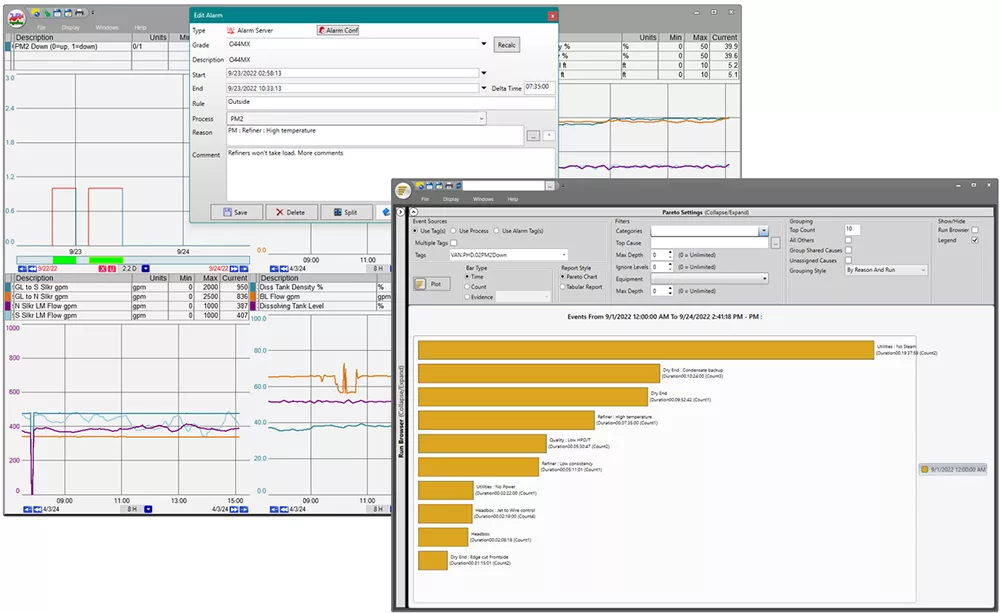
Maximize utilization with downtime tracking software, recording and analyzing downtime directly in trends, and evaluating impacts through comprehensive Pareto analysis for effective production time management.
Actual production time is vital for assessing the effectiveness of production schedules and the efficiency of resource utilization.
12. Machine Downtime
Machine downtime tracks the periods in production schedule when machines are not operational due to breakdowns or maintenance. It’s crucial for manufacturing operations to minimize these downtimes to maintain steady production flows and meet output targets.
Track the total unplanned time that equipment is not operational due to failures or repairs. Reason trees, where operators can choose from a pre-determined set of reasons help narrow down the options. Many tools have a comments field to expand on the reason in more detail, which helps for continuous improvement later on. Set a target to minimize downtime by establishing benchmarks based on past performance and reasonable reductions over a designated period.
Implement a consistent reporting system that captures downtime incidents in real-time, providing data that helps in quick troubleshooting and long-term preventive strategies to enhance machine availability and reliability.
13. Scrap Rate
The scrap rate is the percentage of materials processed that do not result in a sellable product. Reducing scrap rates not only cuts costs but also improves material usage efficiency, which is crucial for minimizing waste and enhancing environmental sustainability.
Make sure to track material wasted in order to calculate the scrape rate. To get a target, look back at historical data and enviornmental goals to establish a the new goal for minimizing waste. Depending on the meansurement, this manufacturing KPI can be displayed for each process area, on dashboards in real-time. This ensures everyone is aware of the waste being produced in real time, and helps identify areas for improvement.
Mastering Manufacturing Metrics
Efficiently tracking and analyzing manufacturing KPIs is fundamental to mastering the art of manufacturing management. By focusing on these critical metrics, manufacturers can gain deep insights into their operations, allowing for continuous improvement and enhanced decision-making capabilities.
This approach not only streamlines production processes but also boosts overall operational efficiency and customer satisfaction. As you strive to elevate your manufacturing operations and improve your overall equipment effectiveness, consider learning more about effective manufacturing KPI management.
Ready for peak plant performance? Download our Ultimate Guide for more information on establishing, measuring, and reporting manufacturing KPIs.
Mastering Manufacturing Metrics
The Ultimate Guide to Establishing, Measuring, & Reporting KPIs for Peak Plant Performance