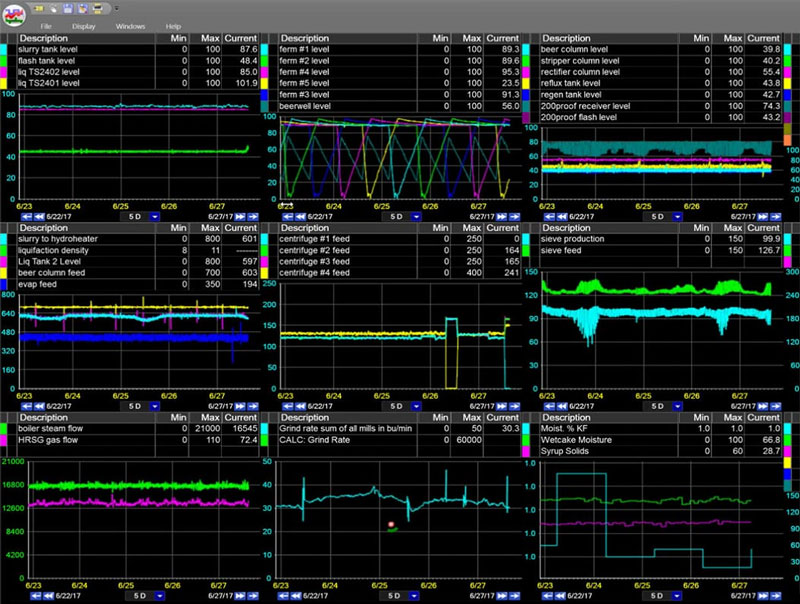
Go beyond a typical gap analysis with a real-time gap tracking dashboard. Minimize manufacturing gaps such as operational cost or waste by creating gap tacking systems such as dashboards that calculate the gap in real-time rather than at the end of the month.
In this article we outline why in line gap tracking is beneficial and walk through the steps to create real-time calculations and dashboards to track manufacturing gaps as they happen, allowing operations to make data-driven decisions.
Why Gap Tracking?
Gap Tracking is going a step beyond gap analysis. Gap analysis is the comparison of actual operating conditions against targets, this is typically done monthly and is an important tool in the continuous improvement process. However, gap analysis has some shortcomings. The feedback loop is drawn out — by the time you can collect the data and compare values it can be days or months after the fact. This can prevent actionable solutions and cause lost opportunity.
To resolve these shortcomings operations needs information in real-time correlated to the levers they can pull on the machine. They need the power to make decisions and adjustments based on this information. The real-time information needs to be quick and easy to view and understand. Progress made needs to be measured and visible in real-time. A dashboard can help provide this information.
Dashboards help visualize the live data and updates or changes to a graphic can happen relatively quickly. Operations can utilize a real-time gap tracking dashboard to alert them of what is causing the gap and get the process back on track in the moment, rather than realize the problem days, weeks, or months later.
How to Create a Gap Tracking Dashboard
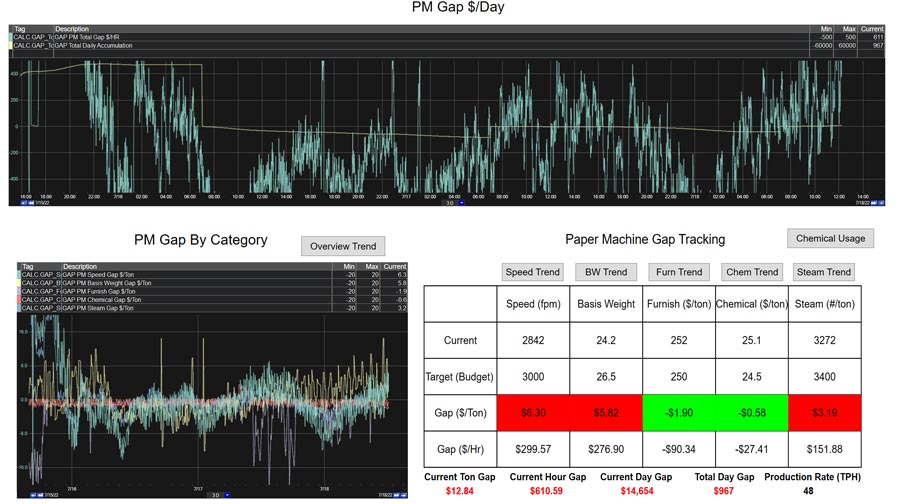
Follow along as we demonstrate how we built this gap tracking dashboard.
Conduct a Gap Analysis
The first step in creating a Real-Time Gap Tracking dashboard is to complete a Gap Analysis:
- Define the area of focus and targets
- Measure the variables
- Analyze to targets against the current values
- Improve the process to with Quick Wins to minimize large gaps
- Control with routine Gap Analysis, this can include creating a Gap Tracking dashboard.
Gap Tracking Requirements
Regardless of the process and gap being tracked, the same general information is needed to build a gap tracking dashboard. Many of the following requirements will be pulled from the Gap Analysis.
Adequate measurements
Similarly to Gap Analysis, adequate measurements are required for gap tracking, however measurements may need to be taken more frequently for a reactive gap tracking calculation to be performed. This can be a challenging step, but the more variables that are able to be measured closer to real-time will provide more accurate gap tracking calculations.
If variables only have 3-4 data points per day, it can be difficult to see how changes affect the gap in real time. It is possible that variables without adequate measurement are removed from the dashboard and more emphasis is taken on those with more datapoints.
Process baselines
Process baselines are a great way to determine targets if they are not already outlined. Overall process targets typically come from upper management or operational plans. It is necessary to break these overall targets into their individual inputs. Those inputs could be broken down even further. Depending on the process, there could be targets for different products.
One way to determine baseline is finding times of good quality and production, what were the operating conditions and how can they be replicated.
Once a list of individual variables is created a target should be assigned. By meeting each target, the overall target should be met. If the individual variables do not have targets, the process baselines can be used instead.
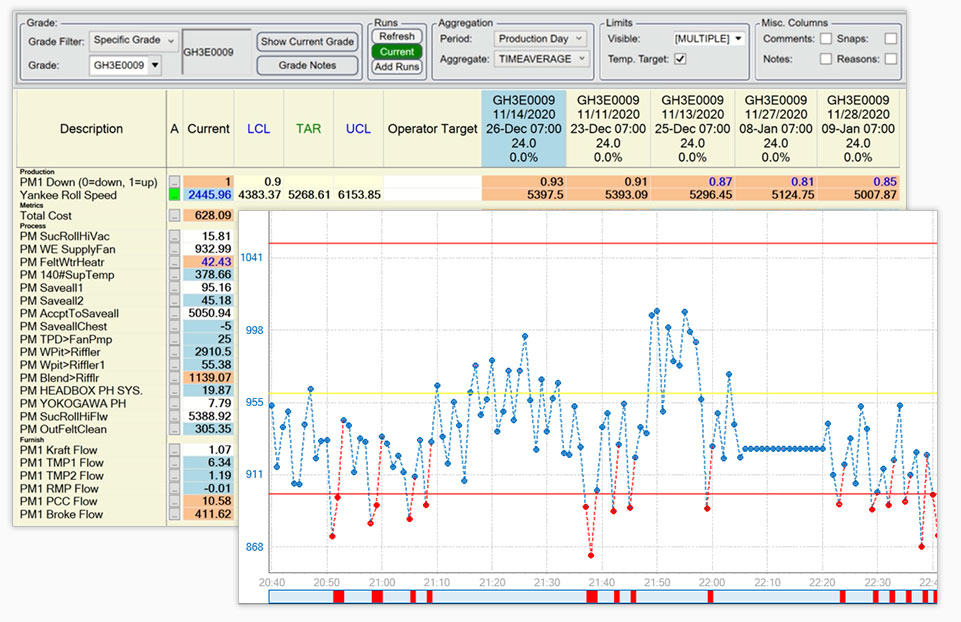
dataPARC’s Centerline display is a smart aggregation tool which can be used to help establish operation baselines
Custom calculations
Another key step in building a gap tracking system is to standardize measurements and units. All variables should be converted to a per unit basis, some common options include dollar per ton, dollar per hour, off quality ton per ton or waste ton per ton.
Once all the input variables are converted to the same unit, they can be combined to create the overall process gap.
Value opportunities
Involving those with a high degree of process knowledge is critical. They will be able to help identify all the process inputs, then narrow the list to variables that can provide the most value opportunities.
These value opportunities are then tied into the gap tracking dashboard as an operator workflow. The workflow will focus on the variables that operators are able to control and has the greatest effect on the gap. This is where the calculated gap gets connect to process levers that the operators can manipulate to get things back on track.
With insight from a process expert one or two variables may stand out as most room for value added opportunities.
These variables should be the focus when it comes to the layout of the graphic. As most read from left to right, top to bottom, the most important information should appear in the upper left of the dashboard (or oriented closest to the operator if the monitor is going to be off to the side or high up). This will help ensure that those variables with the most opportunity to close the gap are being looked at first.
Operator buy-in
Ultimately, operators are the ones who will be using the dashboard to make data driven decisions in real time. Involve those who will end up using the dashboard as part of the design and implementation to help build ownership and operator buy in. Without operator buy in, the dashboard is a waste.
Software to visualize the dashboard and perform the calculations
Find the right visualization tool for your site. A process data visualization tool should be able to view trends, a grid with the ability to change colors or provide alerts and link to other displays or trends for quick data interpolation.
In this example dataPARC’s Graphic Designer was used to build the dashboard.
Depending on the process and number of inputs these calculations can get rather large and take a while to process on the fly, and even longer if looking at data in the past.
dataPARC’s Calc Server allows for calculations to be historized making this a great tool to use for fast calculations and viewing history.
Considerations When Building & Using a Gap Tracking Dashboard
Gap tracking dashboards are going to look different from machine to machine and site to site. Here is a list of suggestions to keep in mind while building your own gap tracking dashboard.
- Use grids and rolled up data to convey the current gap. Colored or pattered backgrounds can help draw attention.
- When a gap occurs, what levers can operations pull to make a change? These variables should be a focus on the dashboard. This can be done by adding trends, focused metrics, or a link to another display to “zoom into” that lever and see if a change can be made and how
if effects the process. - Work with operators to determine those levers and key pieces of information, ask what would be helpful for them to see on this dashboard. The goal is to get all the important information in one place.
- Monitor the progress, determine if the overall gap is decreasing, if not determine why. Make changes to the dashboard as needed.
- The dashboard should provide information without settings requirements on how to run as not all the variables are always within the operators control.
Manufacturing Gap Tracking Example
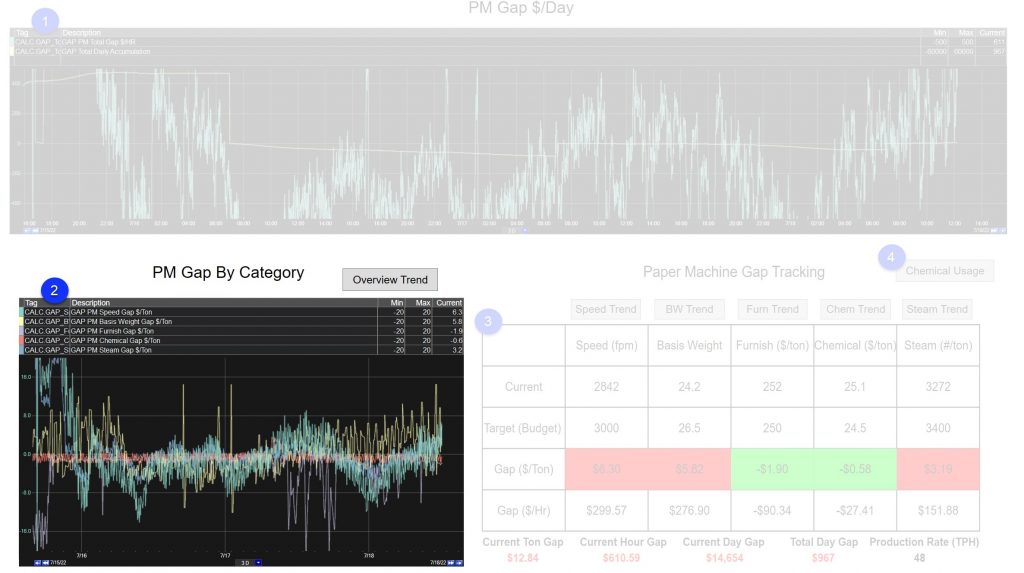
Let’s look at a Gap Tracking dashboard for a paper machine.
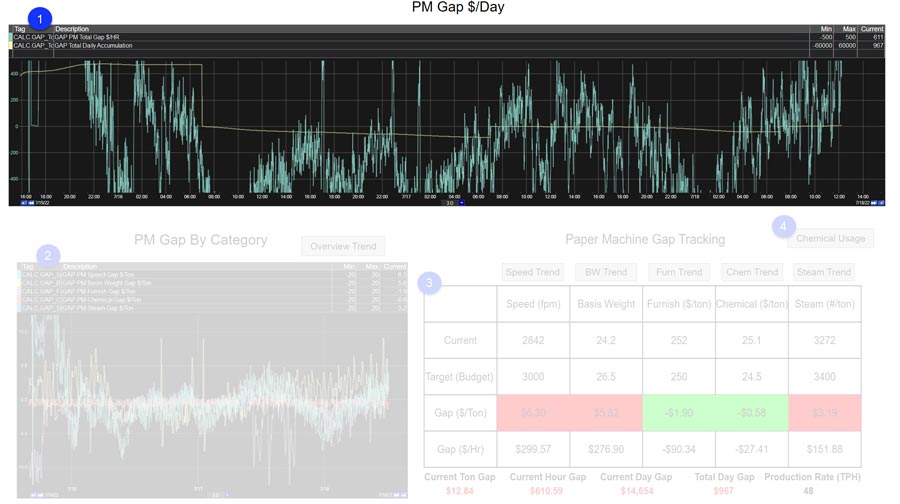
1. Summary Trend
The first thing is a large trend showing the overall paper machine gap in dollars per day. The blue line represents the real-time gap and the yellow the target.
2. Category Trend
The second trend in the bottom left shows the individual calculated gaps by category. These are also on a dollars per day basis. This view allows the user to quickly identify it a category is trending in the wrong direction.
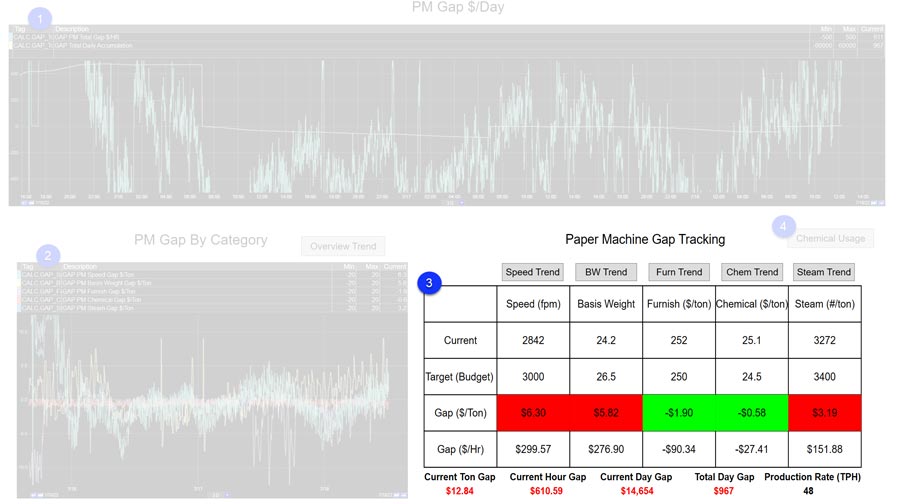
3. Gap Tracking Table
The table in the bottom right of the screen shows the current category gaps on a dollar per ton and dollar per hour basis. The values are highlighted red for over expected cost and green for under. At a glance, users can see what the current status of each category is.
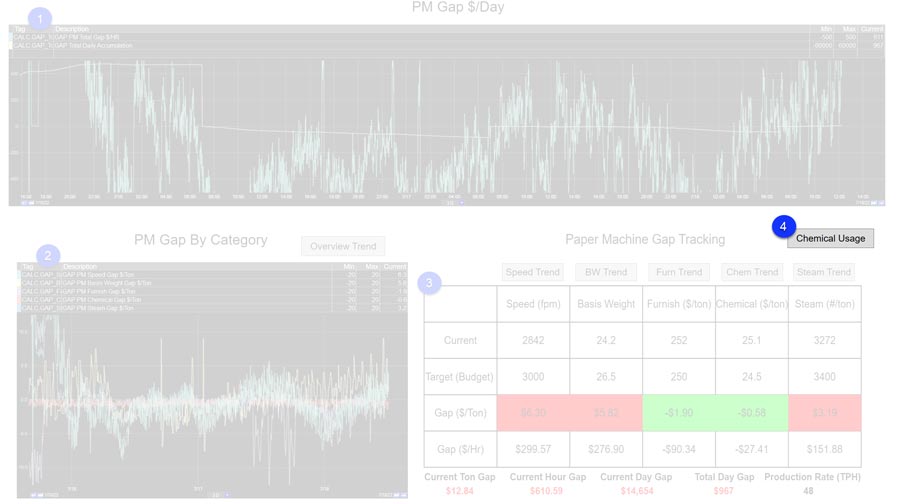
4. Chemical Usage
Off to the right is a chemical usage button that will pull up another display. This button was added because chemical usage was found to have multiple inputs and levers for the operator to pull to close the gap.
Watch the video below to see this gap tracking dashboard in action.
Manufacturing analytics software like dataPARC’s PARCview offer tools to help manufacturing companies perform real-time gap tracking post-gap analysis.
Conclusion
A gap tracking dashboard can provide operators with a clearer picture of the gap in real-time, allowing them to make data-driven decisions. The alerts and real-time calculations bring awareness, letting operators know when something isn’t running optimally.
It is a way to drive process savings by tying analytics to actionable changes.
Instead of waiting for the end of the month to find there was a gap, it is found in real time. Bring troubleshooting into the present, changes can be made in real time to reduce or prevent larger process losses.
Although gap tracking dashboards are powerful tools, they do not replace regular Gap Analysis. To drive continuous improvement, Gap Analysis should be done regularly, targets on the gap tracking dashboard should be adjusted to reflect any process changes.

