Minimize manufacturing gaps such as operational cost or waste by performing a gap analysis with process data. In this article we will walk through the steps of a basic manufacturing gap analysis and provide an example.
Implement real-time gap tracking with dataPARC to help you optimize & control your processes
What is a Gap Analysis for Manufacturing?
A gap analysis is the process of comparing current operating conditions against a target and determining how to bridge the difference. This is an essential part of continuous improvement and LEAN Manufacturing.
A manufacturing gap analysis can be performed on a variety of metrics, such as:
- operational costs
- quality
- productivity
- waste
- etc.
When it comes to bridging the gap, the ideal case is to reach the target with a single and permanent change. This is not always the case, there are times where the gap is going to be fluid and would benefit from constant monitoring and small adjustments. In these cases, operations can utilize a real-time gap tracking dashboard to alert them of what is causing the gap and get the process back on track in the moment, rather than realize the problem days, weeks or months later.
Manufacturing analytics software like dataPARC’s PARCview offer tools to help manufacturing companies perform real-time gap tracking post-gap analysis.
Who Conducts a Manufacturing Gap Analysis?
Gap analysis can be performed by anyone trying to optimize a process. As mentioned above there are a multitude of metrics that can be measured.
A process engineer might want to reduce operational cost by focusing on energy consumption, someone in the finance department may notice an increase in chemical cost every month, and a supervisor may want to reduce the time it takes to complete a task to focus on other items.
Almost every department can leverage gap tracking in one way or another.
How to Perform a Gap Analysis in Manufacturing
Like many other improvement strategies, we can use the DMAIC method (Define, Measure, Analyze, Improve, Control) to perform a gap analysis and implement a live gap tracking dashboard.
To create a gap tracking dashboard, a gap analysis needs to be completed first. In the last stage, Control, the dashboard is created, and operations can perform steps Analyze-Improve-Control in real-time.
1. Define
The first step is to define the area of focus and identify the target. A great place to start when looking for an area of focus is the company’s strategic business plan, operational plan, or yearly operational goals. Many times, these goals will already have targets in place.
2. Measure
Next, the process must be measured. Take a close look at the measurement system. Is the data reliable? Does the measurement system provide the necessary information? If so, measure the current state of the process.
If there is no current measurement system, one will need to be created. Although in-process measurements or calculations are best, manual input can also be used.
Some manufacturing analytics providers, like dataPARC, offer manual data entry tools which allow users to create custom tags for manual input. These tags can be trended and used the process tags in dashboards and displays.
3. Analyze
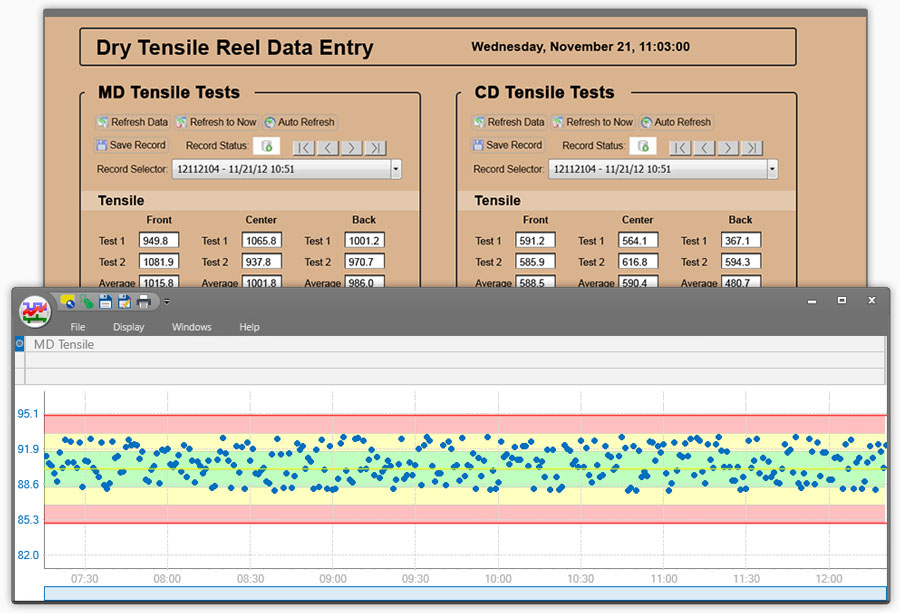
Take the data and compare it to the goal. How far from the target is the process? This is the gap. It may help to visualize the process gap in multiple ways such as with a histogram or trend display.
This histogram provides the overall distribution of the data which can help narrow the focus. What does the peak look like, is it a normal distribution, skewed to one side, is there a double-peak, or edge peak?
A trend shows how the process is shifting overtime, are there times of zero gap vs large gaps such as shift or season?
With the measurement system in place, the gap realized, and some graphical representations of the data, it is time to brainstorm potential causes of the gap. Brainstorming is not a time to eliminate ideas, get everything written down first. There are a variety of tools that can be used to help in this process:
Fishbone Diagram
This classic tool helps determine root causes by separating the process into categories. The most common categories are People, Process/Procedure, Supplies, Equipment, Measurement and Environment, other categories or any combination can be used to fit the situation.
The fishbone diagram is a classic tool for performing root cause analysis.
The team can brainstorm each category and identify any causes that could play a role in the problem. Dive one step further with a 5-why analysis, a method that simply asks “why” until it cannot be answered any more to ensure the true root cause is uncovered.
Is gap analysis one of your digital transformation goals? Let our Digital Transformation Roadmap guide your way.
SWOT Chart
This chart is made of four squares, with labeled sections: Strengths, Weaknesses, Opportunities, and Threats. This strategy is used to determine the internal and external factors that drive the effectiveness of the process. For potential root cases, focus on what appears in weaknesses and see if potential solutions find their way to opportunities.
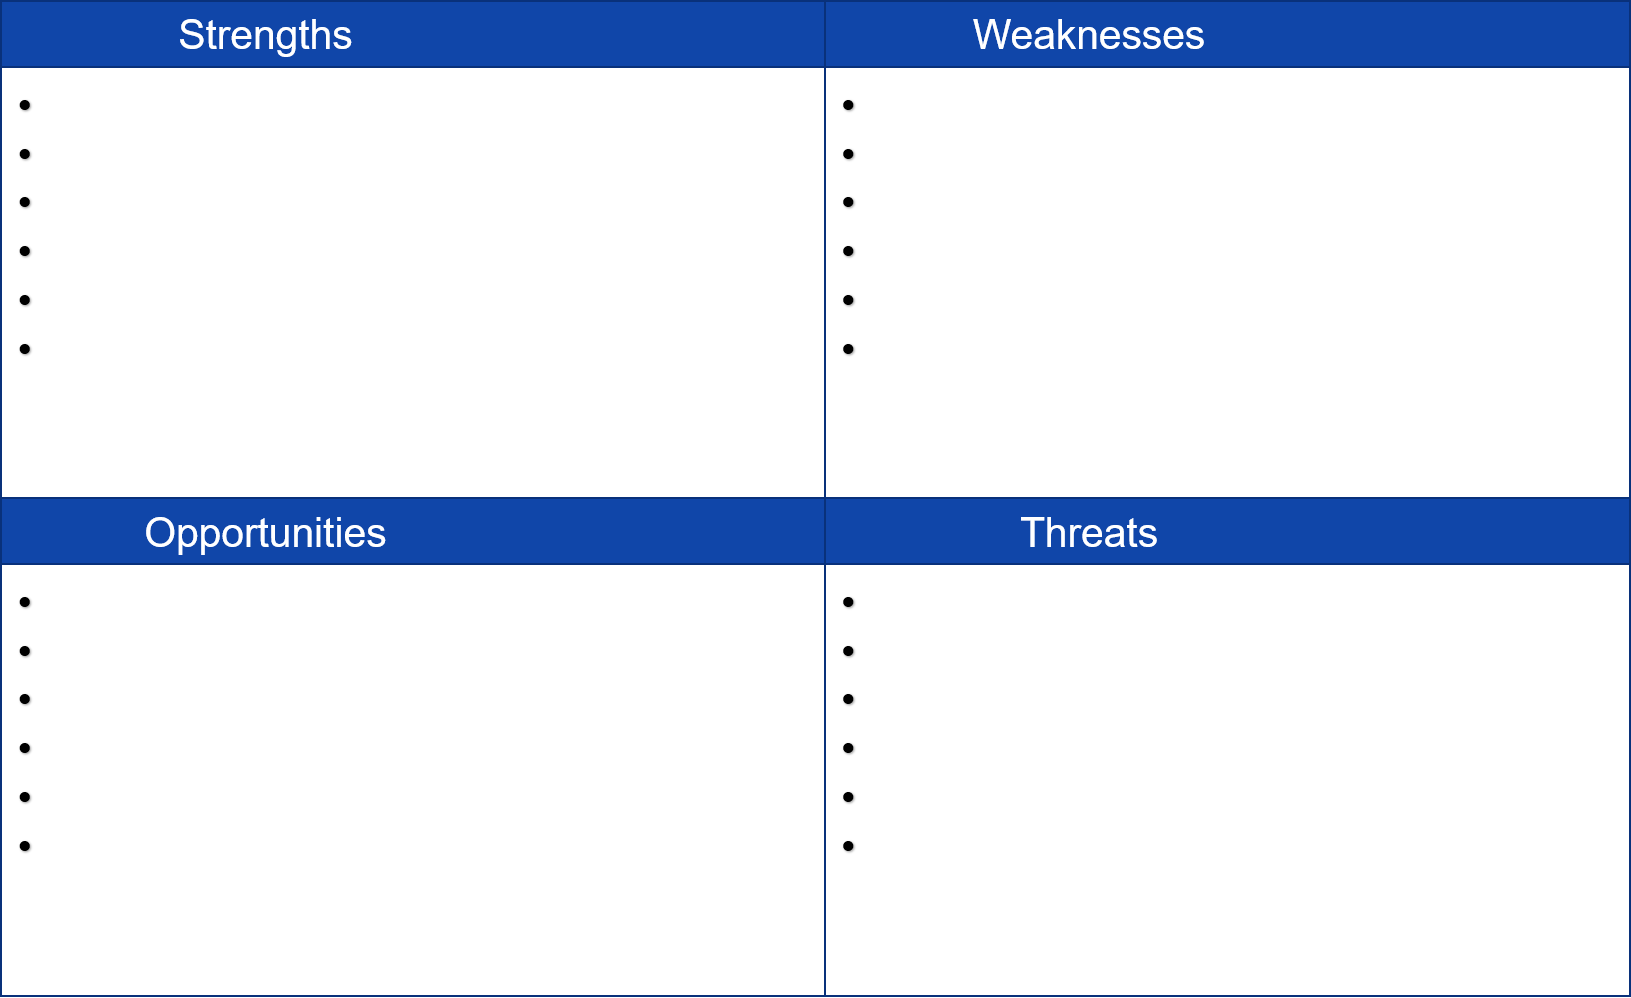
SWOT charts are another fundamental root cause analysis tool.
McKinsey 7s web.
The McKinsey framework is made up of 7 elements, categorized as 3 “Hard” or controllable elements and 4 “Soft”, non-controllable elements. In each element, write the current and desired state. It is important elements are in alignment with one another, any misalignment could point to a root cause.
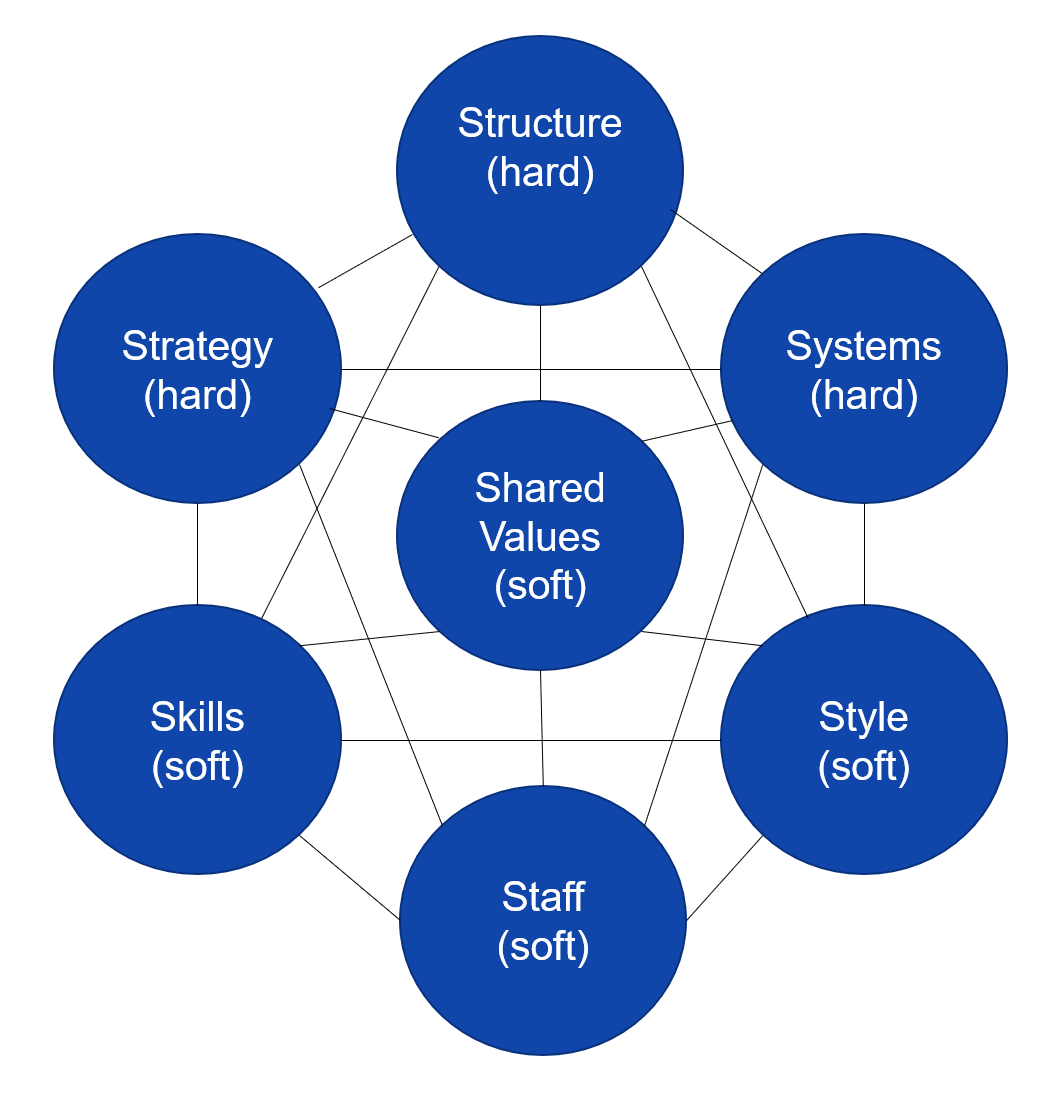
The McKinsey Framework.
4. Improve
Determine the best way to bridge the gap and implement the changes. A payoff matrix or efficiency impact trend can help pick the most effective, least costly options. Focus on quick wins. Items in busy work can be completed but are not a priority. Those in Major Projects, you must ask, is the price work the impact? Anything that is low impact and high cost can be dropped.
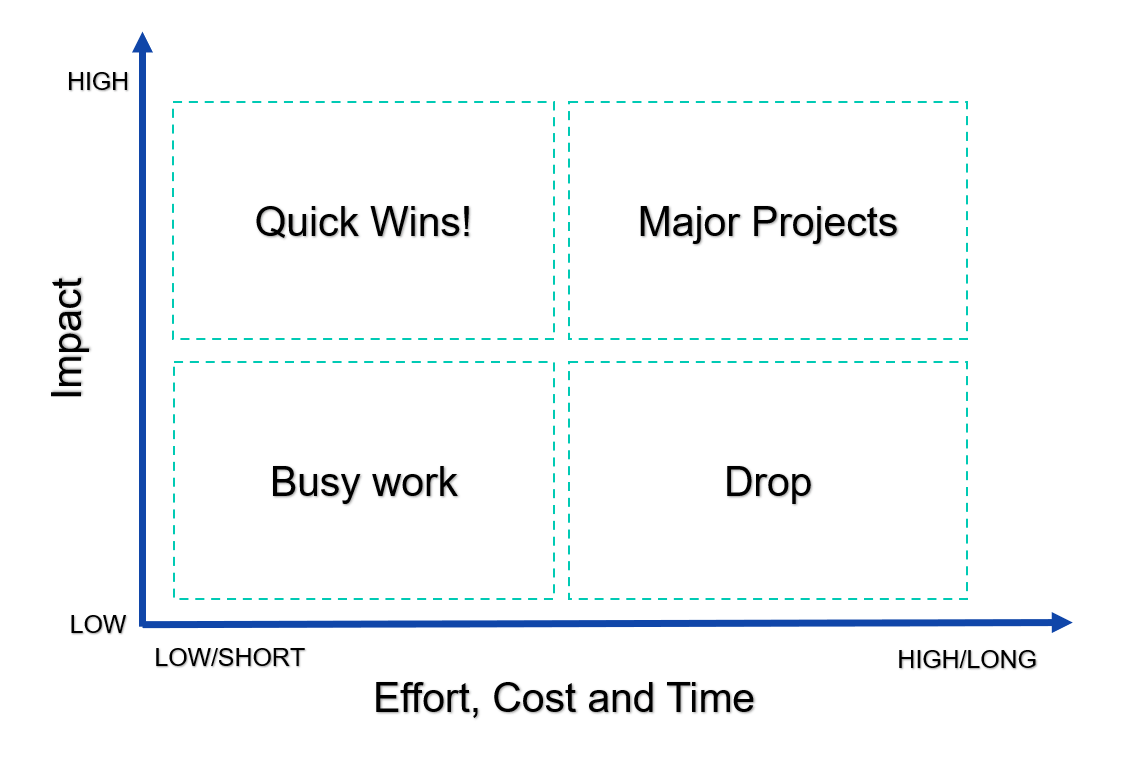
A payoff matrix or efficiency impact trend can help you determine the best way to bridge gaps.
After the solutions are implemented, check the results by analyzing the data again and see if there was an improvement.
5. Control
Once the target is met it is important to keep it that way. Monthly reports can be used to keep track of the process gap and make sure it stays in the desired range.
Set up a dashboard, or other visual to monitor the process in real time. By tracking the gap of the process in real time, operations can see how changes to the process effect the bottom line in real time, rather than at the end of the month.
On the road to digital transformation? Get our Free Digital Transformation Roadmap, a step-by-step guide to achieving data-driven excellence in manufacturing.
An Example of Gap Analysis for Manufacturing
In this manufacturing example we are going to walk through a gap analysis to improve operational costs on a single paper machine.
Define
The company’s operational plan has a goal for monthly operational cost. To break this down into a manageable gap analysis, the focus will be looking at a single machine. This machine is not currently meeting the monthly operational cost goal on a regular basis.
Measure
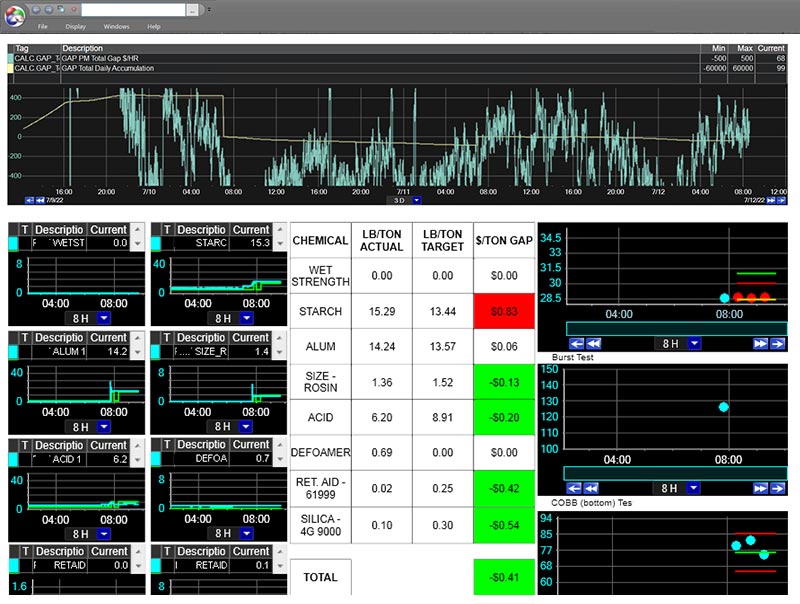
Since this is an initiative from an operational plan, there is already a measurement system in place. The machine operational costs are broken down into 5 variables. Speed, Steam, Chemical, Furnish and Basis Weight.
These variables are measured continuously, so data can be pulled in hourly, daily, and/or monthly averages. The variety of data views will help in the next stage. Each of these variables have a target, but some are missing upper and lower control limits.
Analyze
First, the combined daily operational cost was compared against the target. There were days where the target is met, but it is not consistent.
Next, each of the five variables were compared with their targets separately over the past several months. From this view, Chemical and Steam stood out as the two main factors that were driving up the operational cost. With that in mind, we moved onto the Fishbone diagram and 5-why analysis.
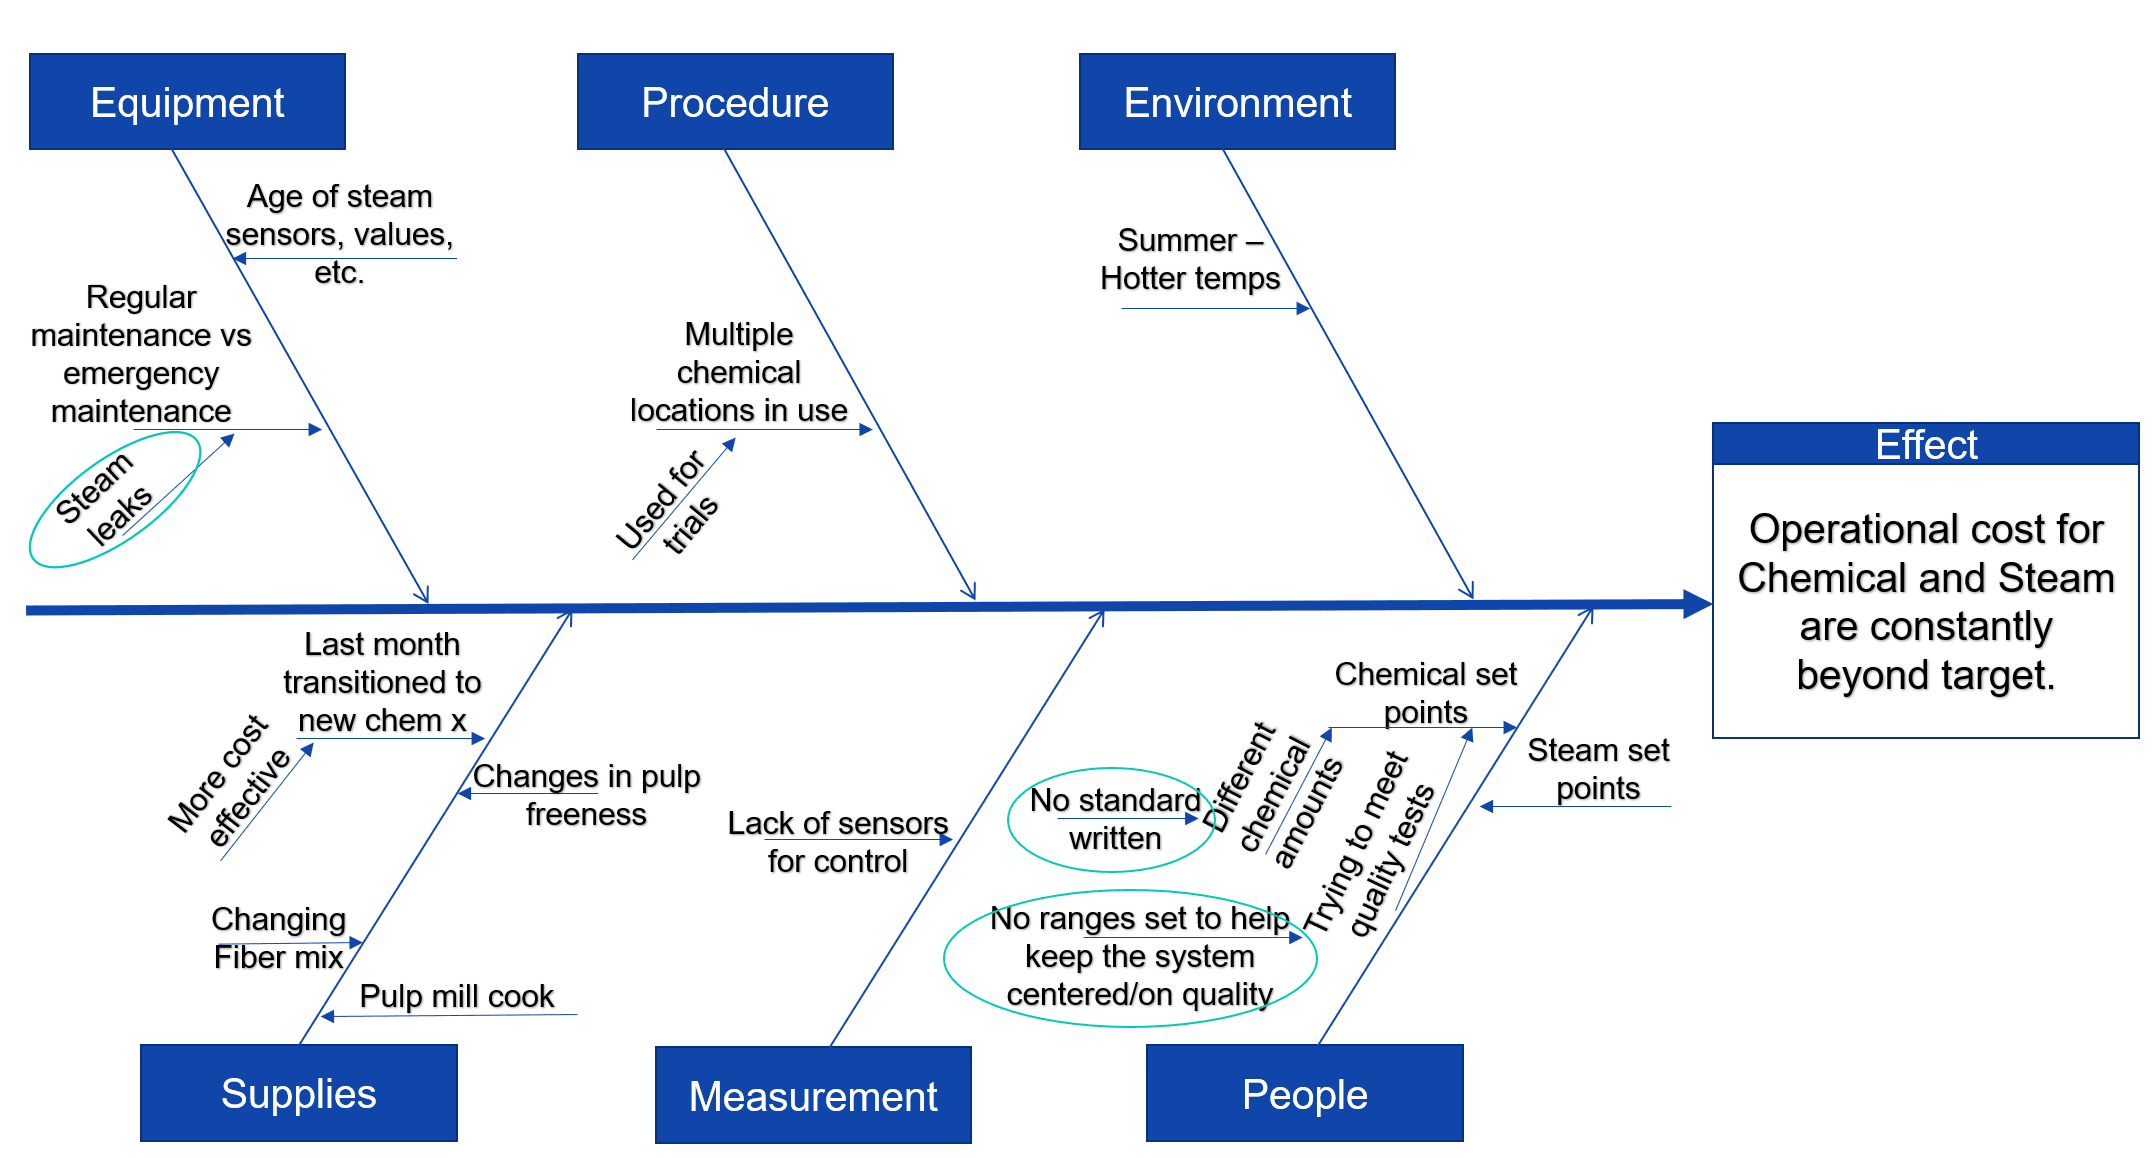
Using the fishbone diagram we were able to determine that chemical and steam were the two main factor driving up our costs over the past several months.
Improve
From the fishbone and 5 why root cause analysis, we found that there were targets but no control limits set on all the chemicals. Operators were adding the amount of chemical they felt would accomplish the quality tests without trying to only apply to necessary amount.
Thinking about the cost/effectiveness diagram, it is cost free to add control limits to each chemical additive. Engineers pulled chemical and quality data from multiple months, created a histogram to find the distribution and set up control limits to help the operators have a better gauge of how much chemical to apply and the typical range that is needed to satisfy any quality tests.
For steam, there were a lot of potential root causes around the fiber mix and cook. The mill already has SOPs to deal with situations such as bad cooks. Another root cause that came up during the fishbone was steam leaks. Most leaks can be fixed while the machine is running, so over the next several weeks there was a push to find and close major leaks.
Control
In this case, since limits were created for chemical usage, alarms were also created to alert operations if they exceeded the control limit. Alerts are a great way to notify operations when processes are drifting out of control so quick corrects can be made.
After a few weeks of these changes, another analysis was be completed. The operational costs are meeting target, and it was time to move to the next process. It is important not to forget about the operational cost, this was monitored monthly to ensure it does not exceed the target.
Conclusion
Performing routine gap analysis is an important step in LEAN Manufacturing and continuous improvement. By following the above steps manufacturers can optimize their process by reducing waste, operational costs, improving quality or going after other key metrics.
Want to Learn More?
Download our Digital Transformation Roadmap and learn what steps you can take to achieve data-driven success in manufacturing.