One of the problems in process manufacturing is that processes tend to drift over time. When they do, we encounter production issues. Immediately, management wants to know, “what’s changed, and how do we fix it?” Anomaly detection with time series data can help provide some quick answers.
Watch the webcast to see us use deviation detection to troubleshoot process issues.
When a manufacturing process deviates from its expected behavior, there are several problems that arise. The plant experiences production issues, quality issues, environmental issues, cost issues, or safety issues. It is critical to identify anomalies so they can be eliminated.
When one or more of these issues present its self it is time to look at the data to help understand “what changed?” Of course, they’d like to know exactly what to do to go and fix it, but fundamentally, we need to know what changed to put us in this situation.
Usually the culprit is either the physical equipment – maybe maintenance that’s been performed recently that threw things off – or it’s in the way we’re operating the equipment.
From a process engineer or a process operator’s perspective, we need to quickly identify what change by comparing current and historical data. More experienced operators and engineers can look at a trend and identify normal data vs. unusual patterns. Unfortunately, this takes a lot of experience and time, now there are tools to assist in finding complex anomalies. They range from Excel sheets, to predictive models and AI. All of these tools start with a training data set to compare to and work from there.
In order to do this, we need to understand the normal data points. Then we can see how the value has changed, and the frequency of those changes. Or rather, how big are the swings and how often are they occurring?

Time Series Anomaly Detection Methods
Let’s begin by looking at some time series anomaly detection techniques (or deviation detection) methods that are commonly used to detect anomalies troubleshoot and identify process issues in plants around the world.
Absolute Change in Time Series Anomaly Detection
This is the simplest form of deviation detection. For Absolute Change, we get a baseline average where things are running well, and when we’re down the road, sometime in the future, and things aren’t running so hot, we look back and see how much things have changed from the average.
Absolute change is used to see if there was a shift in the process that has made the operating conditions less than ideal. This is commonly used as a first pass when troubleshooting issues at process facilities.
Variability Analysis in Time Series Anomaly Detection
Here we want to know if the variability has changed in some way. In this case, we’ll show the COV change between a good period and a bad period. COV is basically a way to take variations and normalize them based on the value. So high values don’t necessarily get a higher standard deviation than low values because they’re normalized.
Variability charts are commonly used to identify less consistent operating conditions and perhaps more variations in quality, energy usage, etc.
Using Standard Deviations for Anomaly Detection
Anyone who’s done control charts in the past 30 years will be familiar with standard deviations. Here we take a period of data, get the average, calculate the standard deviation, and put limits up (+/- 3 standard deviations is pretty typical). Then, you evaluate where you’re out based on that.
Standard deviation is probably the most common way to identify how well the process is being controlled, and is used to define the operating limits.
Multi-Parameter Methods in Time series Anomaly Detection
Multi-parameter statistical methods used in time series anomaly detection represent a sophisticated approach to identifying deviations from expected patterns. At dataPARC, we employ PCA (Principal Component Analysis) Modeling, a robust technique that leverages the interrelationships among multiple variables to enhance detection accuracy. By modeling variables together rather than in isolation, PCA Modeling effectively narrows the operational range, tailoring it to specific conditions.
This method is particularly advantageous because it adapts the detection thresholds based on rate-dependence and other prevailing operating conditions. Unlike traditional methods that might use static thresholds, PCA Modeling dynamically adjusts these thresholds, offering a more precise, context-sensitive analysis. This adaptive approach allows for the detection of subtle anomalies that are specific to the current state of the process, providing a critical advantage in complex systems where multiple parameters interact in dynamic ways.
The primary benefit of PCA Modeling over simpler anomaly detection methods is its ability to finely tune the detection window. This results in a tailored operational range that is significantly more effective at pinpointing and detecting complex anomalies, specific to the given rate and conditions. Such precision is vital in time-sensitive industrial applications where early detection of potential issues can prevent costly disruptions and ensure continuous process optimization.
Check out dataPARC’s real-time process data analytics tools & see how better data can lead to better decisions.
Setting up Time Series Anomaly Detection in Manufacturing
Now that we have a basic understanding of some methods for detecting anomalies in our manufacturing process, we can begin setting up our detection system. The steps below outline the process we usually take when setting anomaly detection up for our customers, and we typically advise them to take a similar approach when doing it themselves. One thing to note, it is key to have time series data set up and historized. With a lack of or missing data, detecting anomalies is near to impossible.
1. Select Your Time Series Tags
Simple enough. For any particular process area you’re going to have at least a handful of tags that you’re going to want to review to see if you can spot the problem. Find them, and, using your favorite time series data trending application (if you have one), or Excel (if you don’t), gather a fairly large set of data points. Maybe a month or so.
At dataPARC, we’ve been performing time series anomaly detection for customers for years, so we actually built a deviation detection application to simplify a lot of these routine steps.
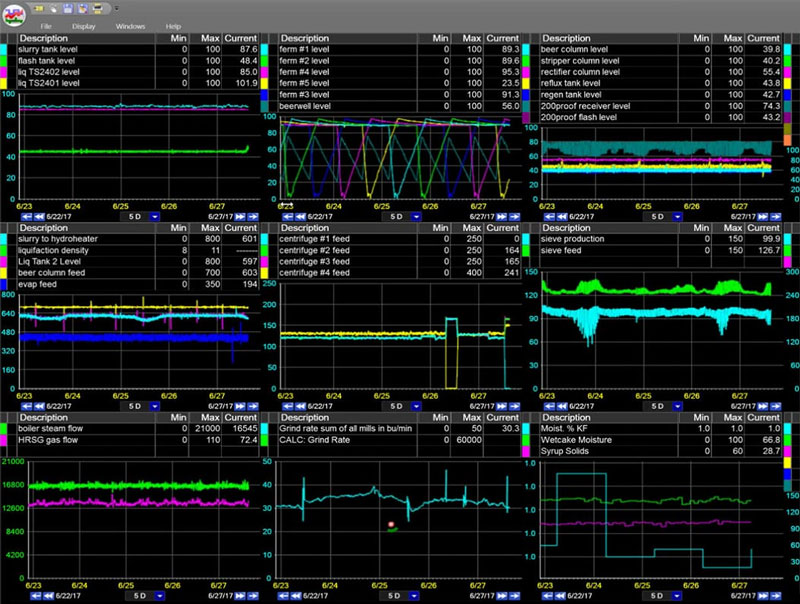
For instance, if we want, we can grab an entire process unit from a display graphic and drag it into our app without having to take the time to hunt for the individual tags themselves. Pretty cool, right?
If we just pull up the process graphic for this part of the plant…
…we can quickly compile all the tags we want to review.
2. Filter out Downtime for Accurate Anomaly Detection
Downtime management is a critical aspect of time series data analysis in process industries. Before analyzing time series data and diving into identifying periods of standard operation and anomalies, it’s essential to account for any downtimes. These periods can significantly skew your data, leading to inaccurate analyses and misleading conclusions.
Downtime.
dataPARC’s PARCview application streamlines this process by allowing users to define specific thresholds that automatically identify and exclude downtime periods. This capability is crucial for ensuring the integrity of your time series analysis by maintaining a focus only on operational data. If you’re using PARCview, this feature will save you considerable time and enhance the accuracy of your anomaly detection efforts.
For those without access to an advanced process analytics toolkit like PARCview, manually filtering out downtime events in tools such as Excel is also possible but more labor-intensive. Regardless of the method, properly accounting for downtime is imperative to achieving reliable insights from your time series data. This step ensures that your analysis reflects true operational performance, free from the distortions introduced by periods of non-operation.
Need to get better data into the hands of your process engineers? Check out our real-time process analytics tools & see how better data can lead to better decisions.
3. Identify Time Periods of Good Data
Now you’re going to want to review your data points. Look back over the month or so of each data point that you pulled and identify a period of time that everyone agrees the process was running “good”. This could be a week, two weeks… whatever makes sense for your process.
Things are running well here.
4. Identify Bad Periods in Time Series Data
Now that we have the base built, we need to find our “bad” period. Whether we’re waiting for a bad period to occur, or we’re proactively looking for bad periods as time goes on.
Here we’re having some trouble.
5. Analyze the Data for Anomaly Detection in Time Series
Yes, it’s important to understand the different anomaly detection methods, and yes, we’ve discussed the steps we need to take to build our very own time series anomaly detection system, but perhaps the most critical part of this whole process is analyzing the data after we’ve become aware of the deviations. This is how we pinpoint which tags – which part of our process – is giving us problems.
Deviation Analysis is a pretty big topic that we’ve covered extensively in another post.
Looking Ahead
Anomaly detection systems are great for being able to quickly identify key process changes, and really the system should be available to people at nearly level of your operation. For effective troubleshooting and analysis, everyone from the operator, the process engineer, maintenance, management… they all need to have visibility into this data and the ability to provide input data.
Properly configured, you should be able to identify roughly what your problem is, within 5 tags of the problem, in 5 minutes.
So, when management asks “what’s changed, and how do we fix it?”, just tell them to give you 5 minutes.
Watch the Webcast
In this recorded webcast we discuss how to use deviation detection to quickly understand and communicate issues with errant processes, and in some cases, how to identify problems before they even occur.