Deviation analysis is a routine form of troubleshooting performed at process manufacturing facilities around the world. When speed is imperative, a robust deviation detection system, along with a good process for analyzing the resulting data, is essential for solving problems quickly.
A properly configured deviation detection system allows nearly everyone involved in a manufacturing process to collaborate and quickly identify the root causes of unexpected production issues.
In a previous post we wrote about time series anomaly detection methods, and how to set up deviation detection for your process. In this article, we’re going to be focusing on how to actually analyze the data to pinpoint the source of a deviant process.

Watch the webcast to see us use deviation detection to troubleshoot process issues.
Deviation Analysis: Reviewing the Data
So, if you read our other article about anomaly detection methods, we covered setting up deviation detection, including the following steps:
- Selecting tags
- Filtering downtime
- Identifying “good” operating data
- Identifying “bad” operating data
The fifth step is to actually analyze the data you’ve just produced, so you can identify where your problem is occurring.
But, before we get into analysis, let’s review the data we’ve produced.
The examples below show the data we’ve produced with dataPARC’s process data analytics software, but the analysis process would be similar if you were doing this in your own custom-built Excel workbook.
Selecting Tags
Here we have the tags we identified. In our case, we were able to just drag over the entire process area from our display graphic and they all ended up in our application here. We could have also added the tags manually or even exported the data from our historian and dumped it into a spreadsheet.
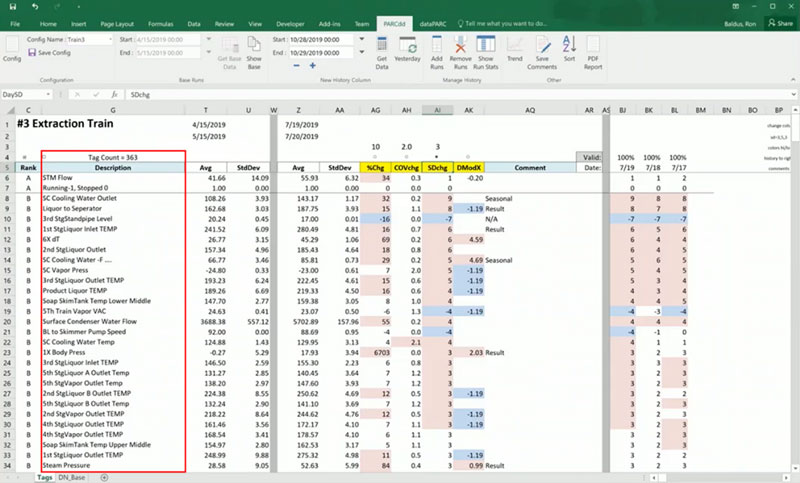
We pulled data from 363 tags associated with our problematic process.
Good Data
Next, we have our “good” data. The data when our process was running efficiently. You’ll see that the values here are averages over a one-month period.
Average data from a month when manufacturing processes were running smoothly.
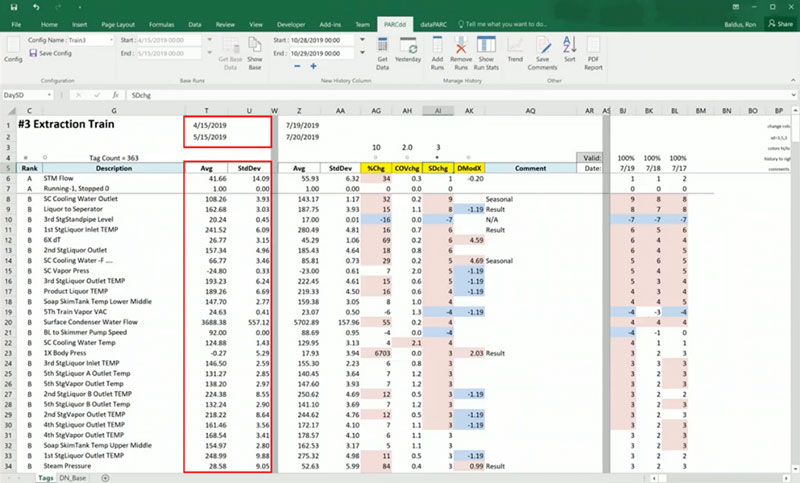
Bad Data
This is our problem data. Narrowed down to a specific two-day period where we first recognized we had an issue.
Bad data
Check out our real-time process analytics tools & see how better data can lead to better decisions.
Methods of Deviation Detection
Again, you can refer to our article on anomaly detection methods for more details, but in this next part we’ll be using 4 different methods of analysis to try and pinpoint the problem.
The four deviation detection methods we’ll be using are:
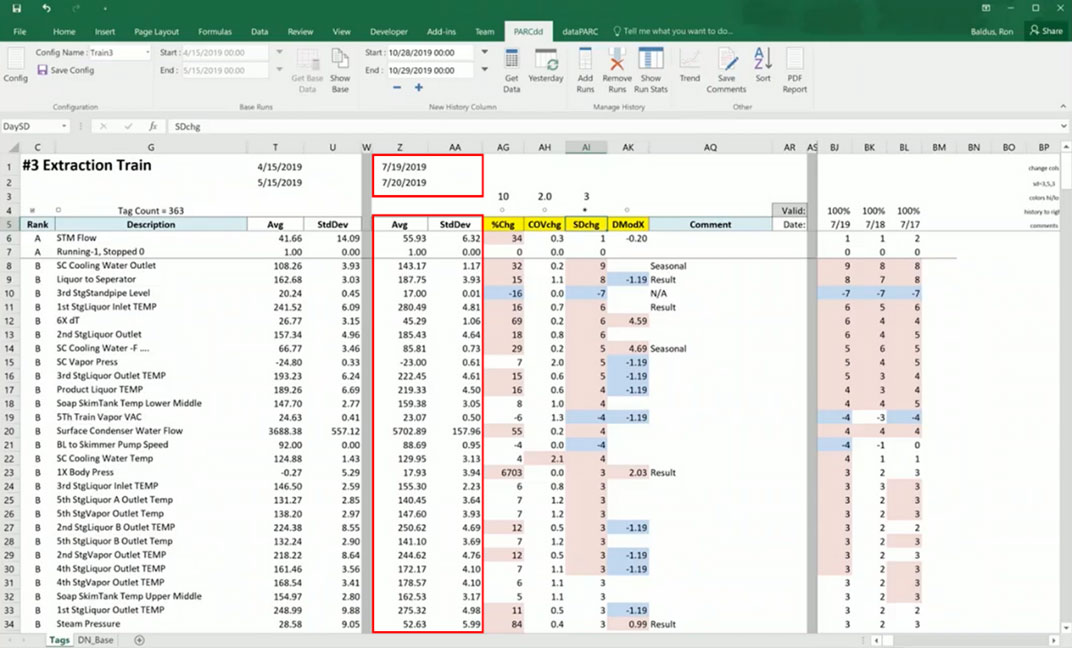
- Absolute Change (%Chg) – The simplest form of deviation detection. Comparing a value against the average.
- Variability (COVChg) – How much the data varies or how spread out the data is relative to the average.
- Standard Deviation (SDCgh) – A standard for control charts. Measures how much the data varies over time.
- Multi-Parameter (DModX) – Advanced deviation detection metric showing the difference between expected values and real data, to evaluate the overall health of the process. The ranges are often rate-dependent.
In the image below you’ll see the deviation values for each method of calculation. Here red means a positive change, and blue means a negative change.
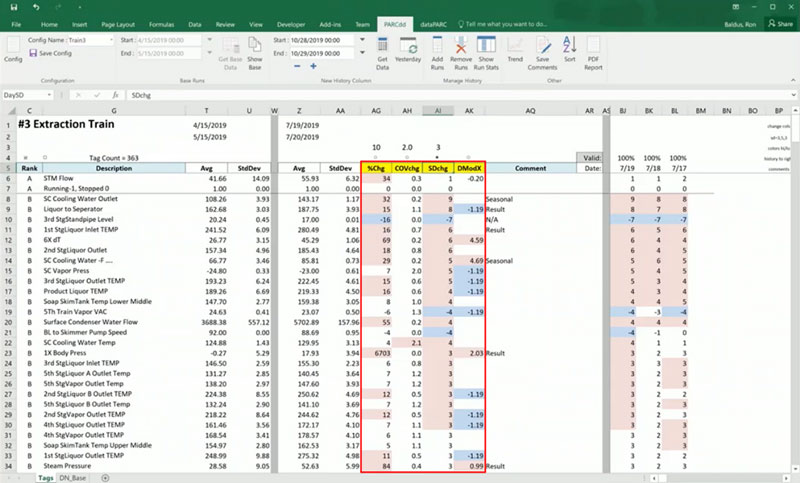
Our four deviation detection methods. Red is positive change in values. Blue is negative value change.
So, if we’re looking for a trouble spot within our manufacturing process, the first thing we’re going to want to do is start to look at the deviation values.
By sorting by the different detection methods, we can begin to identify some patterns. And, we can really pare down our list of potential culprits. Just an initial sort by deviation values eliminates all but about a dozen of our tags as suspects.
So, let’s look at tags where the majority of the models show high deviation values. That gives us a place to begin troubleshooting.
Applied Deviation Analysis
For instance, here we have our Cooling Water tag, and in three of the four models we’re seeing that it has a fairly high deviation value. It’s a prime suspect.
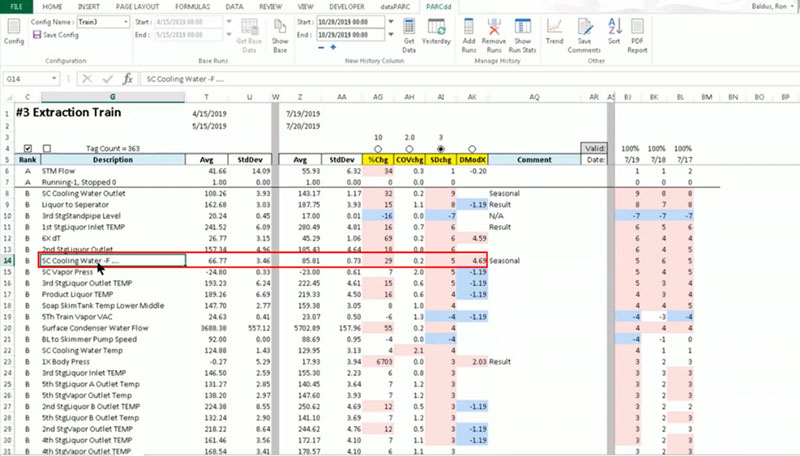
So, let’s analyze that, and take a closer look.
Need to get better data into the hands of your process engineers? Check out our real-time process analytics tools & see how better data can lead to better decisions.
Within our deviation detection application we can just select the tag and click the “trend” button to bring up the data trend for the Cooling Water tag.
Looking at the trend, it’s definitely going up, and deviating from the “good” operating conditions. But we also know our process. And we know that the cooling water comes from the river, and we know that the river temperature fluctuates with the seasons. So, we’ll add our River Temp tag to the trend, and sure enough – it looks like it’s just a seasonal change.
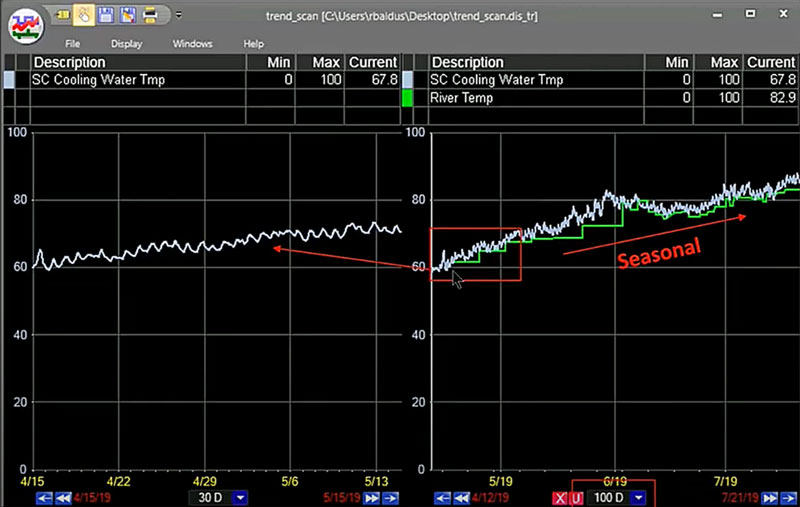
Pairing our Cooling Water Tmp tag with our River Temp tag. Nope, that’s not it!
So, the Cooling Water isn’t our culprit. What can we look into next? This 6X dT tag looks like a problem, with multiple indications of high variation. This represents the temperature change across the sixth section of the extraction train.
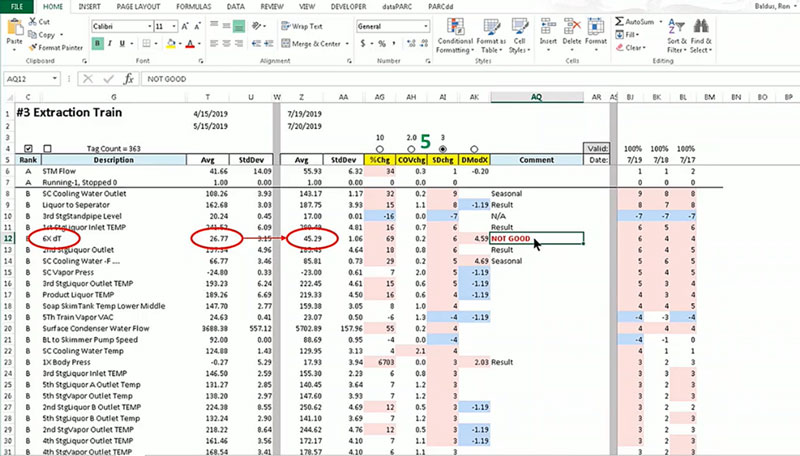
This looks like the source of our problem.
It’s likely that this is going to be our problem tag. Putting our heads together with the rest of the team, we can pretty quickly get anecdotal evidence to either confirm or deny that, say, maintenance was performed in this part of the process recently. If it’s still unclear, we can pull it up on a trend, like we did with our Cooling Water tag, and see if we are indeed seeing some erratic behavior with the values from this tag.
Looking Ahead
Really, this is routine troubleshooting that is done daily at process facilities around the world. But, when speed is imperative, and you need a quick answer for management when they’re asking why their machine is down or the product quality is out-of-spec, having a robust deviation detection system in place, and a good process for analyzing the resulting data, can really help make things clear quickly.
Watch the Webcast
In this recorded webcast we discuss how to use deviation detection to quickly understand and communicate issues with errant processes, and in some cases, how to identify problems before they even occur.


1 thought on “Deviation Analysis in Process Manufacturing”
Comments are closed.