Once you have cleared the important hurdle of collecting and calculating OEE data, it’s time to improve OEE. The entire purpose of OEE is to highlight losses, so all losses must be analyzed, prioritized, and minimized. This can be a bit overwhelming at first, so where do you begin?
Overall Equipment Effectiveness, or OEE, has several benefits over simple one-dimensional metrics like machine efficiency. If you are not meeting demand and have a low, OEE score (equipment is underperforming) then you know you have an equipment effectiveness problem. If equipment is operating at a high OEE but not meeting customer demand, you know you have a capacity problem. Also, OEE lets you understand if you have spare capacity to keep up with changes in demand.
Improving OEE begins with analyzing what we call the Six Big Losses.

Get all the resources you need to successfully implement, analyze, & improve overall equipment effectiveness.
The Six Big Losses in the Manufacturing Process
First of all, each OEE factor (Availability, Performance, and Quality) should be broken down further to provide more granular data. This approach leads to what are known as Six Big Losses.
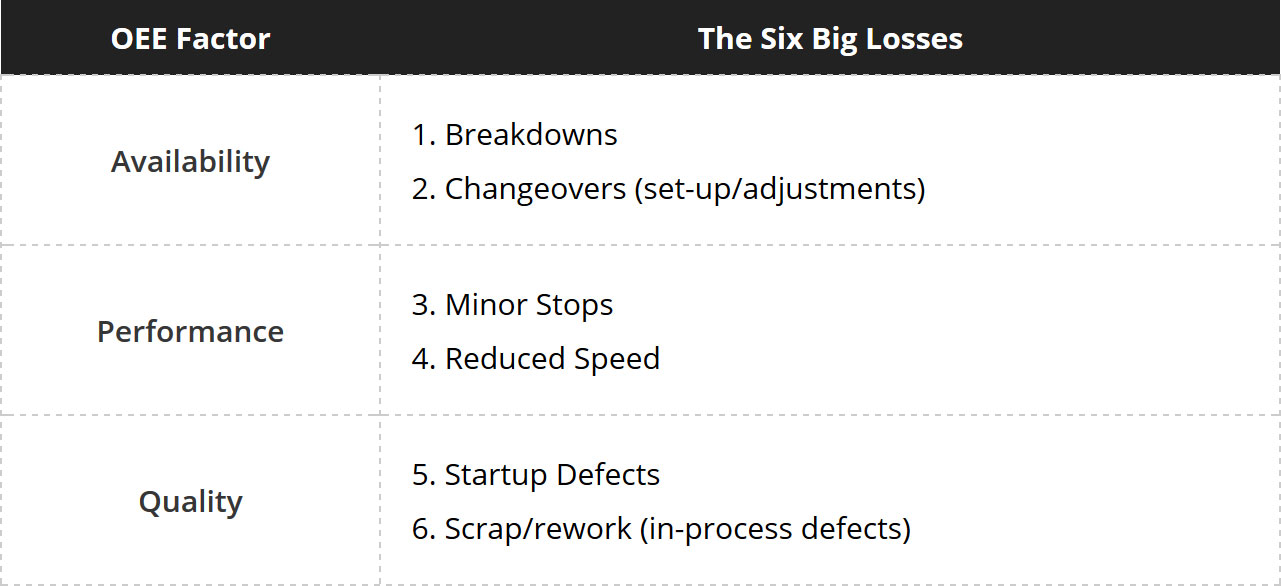
The reason for splitting performance loss from each factor into two categories is that the potential causes are usually different. The Six Big Losses provide an effective way to compare and prioritize production losses, which leads to more successful identification and elimination of the root causes.
A popular way to view these losses in the context of improving OEE, is with the use of a stacked bar or waterfall chart. These visual aids show how much each loss category contributes to the total OEE.
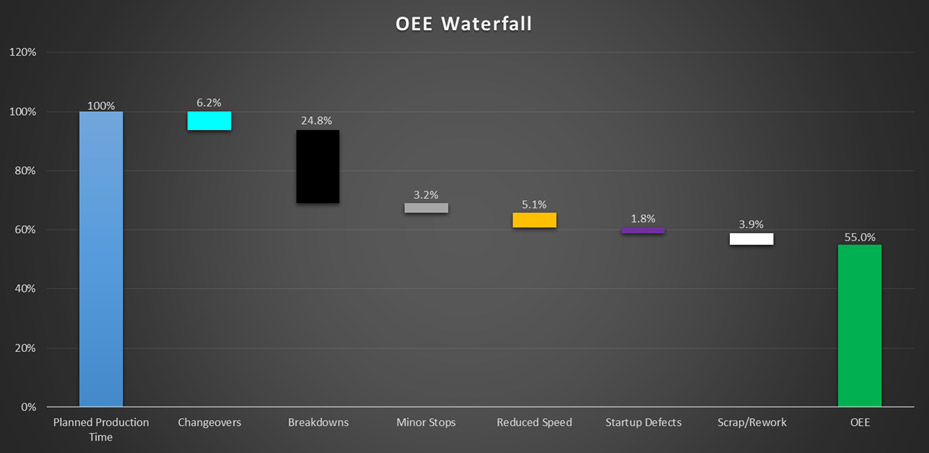
Charting downtime attributed to the Six Big Losses.
Availability
The availability factor can be divided into the first two of the six big losses, changeovers and breakdowns. Both of these are critical because when the machine isn’t running, there is no performance or quality to worry about.
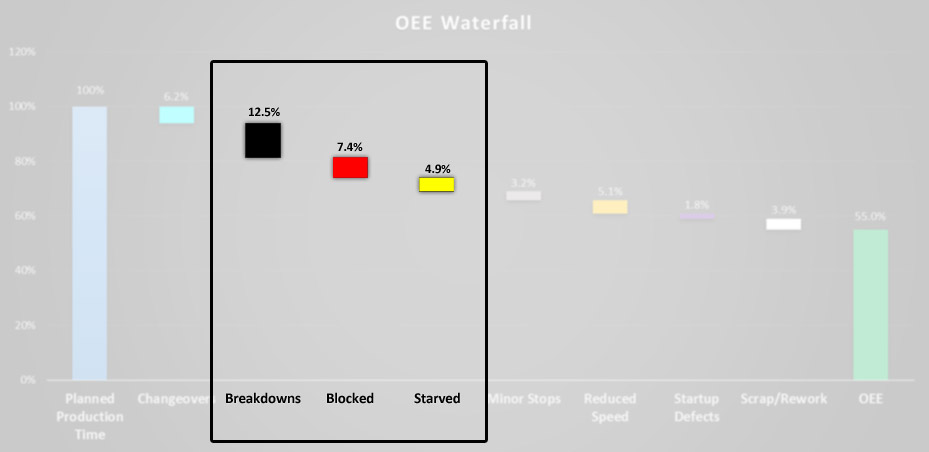
When collecting data for a production line with multiple discrete processes, the availability analysis should be from the perspective of the bottleneck process. The downtime can be further broken down into three categories:
- Breakdowns on the bottleneck process itself
- Downstream breakdowns that block the bottleneck from running
- Upstream breakdowns that starve the bottleneck process
This extra information will help focus reliability improvements. In the example above, there is a high percentage of breakdowns on the bottleneck itself, so the initial effort should be to improve the availability of the bottleneck asset.
Performance
Minor stops are actually short duration downtime events on production lines, such as jams and operator adjustments that do not require maintenance. The definition is flexible, but typically, downtime events are considered minor stops when the duration is less than five minutes, and breakdowns when they are longer than five minutes. Minor stops disrupt the flow of a production line.
The reduced speed category captures the losses of running below the target (maximum) speed. For information about using the right speed target in the performance factor calculation read 6 Keys to Successful OEE Implementation.
Quality
Just like the other factors, the quality factor is divided into startup defects and scrap because there are different causes for these two categories.
Improving OEE
There are many different continuous improvement methodologies that can be applied to improving OEE. There is no right or wrong way to go about it, but the following discussion will provide some guidelines for overall improvement and tools which can be used to minimize each of the Six Big Losses.
The Deming Cycle, or PDSA Cycle (also known as the PDCA Cycle), is one proven, continuous-improvement model that can be easily applied to reduce losses. The PDSA Cycle is a sequence of four logical steps: Plan, Do, Study/Check, Act. This sequence can be repeated indefinitely to incrementally improve OEE.
The first step toward solving a problem is actually identifying the problem you are going to work on. The Six Big Losses and the waterfall chart break out the data into smaller buckets to help identify and then prioritize losses in order to focus improvement activities.
Once you have identified the top losses it’s time to develop an improvement plan. Based on data from your historian application or expert/user knowledge, you need to formulate a theory for possible causes and develop a plan to eliminate them.
After you have developed the plan, it is time to execute that plan and monitor the outcome. The final step is to close the cycle by integrating the knowledge you have gained to adjust the goal, or to formulate a new theory.
Looking for a higher-performance historian? Get an enterprise plant data historian at half the cost.
No matter what method you use for improving OEE, focus on the process/system and not on the person. Even if the root cause is people doing something wrong, focus on why a problem occurs and figure out how to change the system to prevent people from making that mistake.
You may have heard the Japanese term Poka-yoke, which means mistake proofing. Poka-Yoke is a technique used to make equipment or processes safer and more reliable by preventing inadvertent errors. There are many examples of mistake proofing that you see and use every day. For example, new cars are equipped with many monitoring and alert systems to warn of obstacles in your blind spots.
In a manufacturing facility, interlocks are in place to prevent machines from running when guards are open. This can be an effective tool to improve changeover time and eliminate startup defects. Making machine settings simple or even automatic so that changes are repeatable helps eliminate the opportunity for operator error.
Breaking Down The 6 Big Losses
1. Changeovers
Changeovers are a necessary evil of producing different products, but the time it takes can be minimized. SMED (single-minute exchange of dies) is a methodology that breaks down changeover improvement into 3 basic steps.
Identify Changeover Tasks
First, identify all of the changeover tasks and separate them into internal and external tasks. Internal tasks are things that have to be done after the machine has been shut down for a changeover. External tasks can be done while the machine is still running. For example, retrieving machine parts and tools is external, but installing the parts is internal.
Evaluate Internal Tasks
Evaluate the internal tasks and find ways to convert them as much as possible into external tasks. One possibility is to combine several parts into a pre-assembled module that can be quickly removed and installed.
Simplify Internal Tasks
Finally, look for ways to simplify the remaining internal tasks. This could include standardizing fasteners so fewer tools are needed, or even replacing them with quick release mechanisms that don’t require the use of tools.
Changeover time reduction should also include optimizing the production schedule to sequence products so the least number of changes are required. For example, run similar products back-to-back and you might be able to use similar machine settings or have shared parts that don’t need to be changed out.
2. Breakdowns
The breakdown category can be further subdivided. All of the breakdown categories (breakdowns, starved, and blocked) should be separated into planned and unplanned.
Breaking out “breakdown” downtime events.
The goal is to minimize planned downtime and eliminate unplanned downtime. Planned breakdowns can include preventative maintenance and cleaning. Attack the planned downtime with total productive maintenance like changeovers. Unplanned production losses can be either chronic or sporadic, so the frequency and duration/severity should be used for evaluation.
Chronic downtime events occur frequently. Sporadic events occur infrequently, maybe just once, but they last a long time or have a big impact on the business.
Identifying the root cause of sporadic events is usually much easier. For the chronic downtime, some more structured problem solving with dedicated industrial analytics tools may be required. You can follow the PDSA Cycle or whatever methods your organization might use.
Read this post on downtime tracking to make sure you are collecting useful information to help reduce breakdowns.
3. Minor Stops
Minor stops are essentially breakdowns of short duration, but that doesn’t mean that these events don’t have a significant impact on the business.
Automated data collection, typically performed by a facility’s data historian software, is critical for accurately capturing minor stops, but doesn’t overwhelm operators by requiring them to log reasons for every 30 second downtime event.
A lot of minor stops are chronic issues, so if you have a lot of minor stops, operators can usually tell you what problems they deal with every day. You can go out to the line and observe while its running and you will probably see the main causes of chronic minor stops.
Some minor stops may be harder to identify. Integration problems between machines in a production line are common. Machine and conveyor speeds need to be correctly programmed to balance the flow of product between processes. The starved and blocked data can help with minor stops as well. Look for instances when the bottleneck is starved or blocked when there are no minor stops upstream or downstream.
See how dataPARC simplified process monitoring for Catalyst Paper, saving them time and money.
4. Reduced Speed
There are many possible causes for speed loss. Your equipment might be worn so performance has deteriorated. You may have poor quality raw materials that require running at slower speeds. Some operators might have less experience so they are not comfortable running the machine any faster. The training and operating procedures may be inadequate.
To combat this, develop standards to make the process more robust so it doesn’t matter who is running the machine. Operators usually set the machine speed where it gives them the least amount of problems. Go see what problems they are trying to compensate for and eliminate them. Sometimes just making speed loss visible will lead to improved performance because people are aware it is being observed. Whatever the potential causes of slow cycles, focus on the bottleneck because it determines the speed of your line.
Interested in improving OEE? See how our OEE & production montitoring tools calculate, report, & analyze production loss from downtime, lost opportunities, and process slowdowns.
5. Startup Defects
Startup defects should be evaluated as part of your changeover improvement efforts. What can be done to make changeovers repeatable so that the time it takes to consistently produce good products is minimized? Automation and recipes that can automatically download machine settings can reduce a lot of variation during startups.
6. Scrap/Rework
Defects are all about variation in the process. Six Sigma is common methodology lean manufacturing that consists of tools for reducing variation and eliminating defects.
However, you don’t have to be practicing Six Sigma to reduce defects. The goal should be to achieve zero defects, even though this might not be possible.
Defects are directly related to variability, so reducing process variability is key to improving quality. Identify why parts are scrapped and identify process control parameters that impact the quality variable.
Good manufacturing analytics tools will allow you to see key performance indicators identify continuous variables that can be tracked using process monitoring tools, and develop predictive models to approximate the outcome of quality parameters that are measured less frequently.
Continuous Improvement for OEE
There are many different continuous improvement methodologies that can be applied to improving OEE. There is no right or wrong way to go about it, but the following discussion will provide some guidelines for overall improvement and tools which can be used to minimize each of the Six Big Losses.
The Deming Cycle, or PDSA Cycle (also known as the PDCA Cycle), is one proven, continuous-improvement model that can be easily applied to reduce losses. The PDSA Cycle is a sequence of four logical steps: Plan, Do, Study/Check, Act. This sequence can be repeated indefinitely to incrementally improve OEE.
The first step toward solving a problem is actually identifying the problem you are going to work on. The Six Big Losses and the waterfall chart break out the data into smaller buckets to help identify and then prioritize losses in order to focus improvement activities.
Once you have identified the top losses it’s time to develop an improvement plan. Based on data from your historian application or expert/user knowledge, you need to formulate a theory for possible causes and develop a plan to eliminate them.
After you have developed the plan, it is time to execute that plan and monitor the outcome. The final step is to close the cycle by integrating the knowledge you have gained to adjust the goal, or to formulate a new theory.
Get all the resources you need to successfully implement, analyze, & improve overall equipment effectiveness.
7 Strategies to Improve OEE
Addressing the six big losses is essential for improving OEE. These losses—changeover, breakdowns, minor stoppages, reduced speed, start-up defects, and scrap —significantly impact manufacturing productivity and efficiency. By systematically tackling these areas, manufacturers can minimize downtime, enhance performance, and ensure higher product quality. Here are targeted strategies to help mitigate each of these losses and boost overall operational effectiveness.
1. Automate Data Collection and Reporting
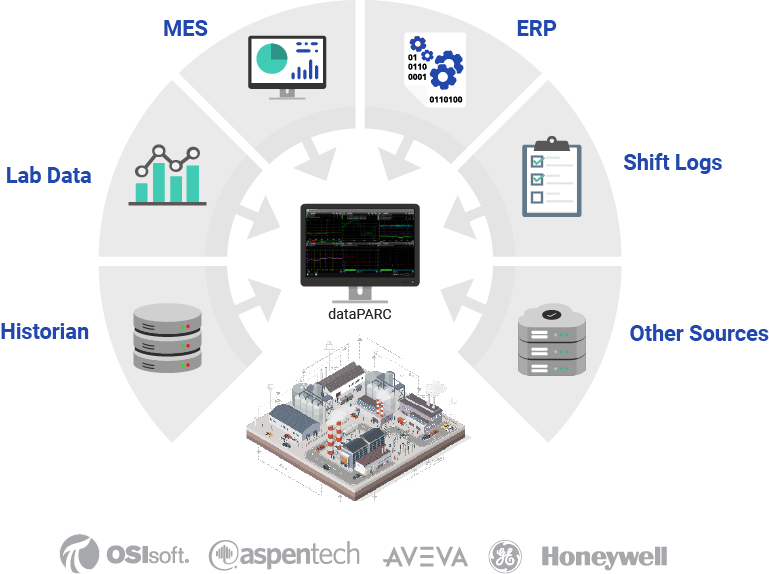
Automating data collection and reporting is a powerful strategy to improve OEE. By eliminiating manually collecting data, manufacturers can capture accurate, real-time data on equipment performance, production processes, and downtime. Automated data collection eliminates manual data collection and entry errors, saves time, and provides immediate insights into operational inefficiencies.
Automated reporting tools can quickly analyze data, generate actionable reports, and highlight areas for improvement. This enables proactive maintenance and faster decision-making. It also allows for continuous process optimization, leading to higher equipment availability, better performance, and improved product quality.
2. Focus on Top Losses for Big Wins
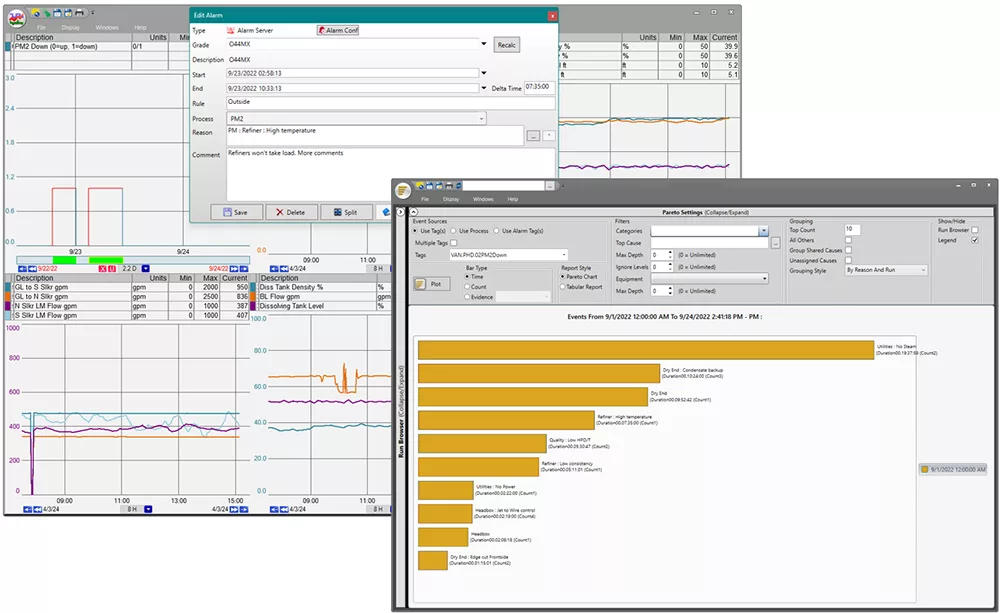
To achieve significant improvements in OEE, it’s crucial to focus on addressing the top losses in your production process. Start by collecting accurate production data, tracking equipment failures and slowdowns along with their reasons. Once a substantial amount of data is gathered, analyze it using a Pareto chart to identify the most significant losses. Prioritize addressing these issues in order of their impact, beginning with the largest. By targeting the biggest losses first, you can quickly realize substantial improvements, paving the way for enhanced efficiency and productivity.
3. Implement Preventive Maintenance
Implementing a preventive maintenance program is a valuable tool for reducing unplanned machine downtime and improving OEE. This approach involves regularly scheduled inspections and servicing of equipment to prevent failures before they occur, ensuring optimal equipment effectiveness. By systematically maintaining production lines, you reduce the likelihood of unexpected breakdowns that can disrupt operations. This proactive maintenance extends equipment lifespan, improves reliability, and ensures consistent performance. When combined with predictive maintenance strategies, it provides a comprehensive solution to minimizing downtime and maximizing productivity, leading to significant OEE improvements.
4. Use Predictive Maintenance
Predictive maintenance leverages data and advanced analytics to predict a potential equipment failure before it occurs. By monitoring equipment conditions in real-time, predictive maintenance systems can identify patterns and anomalies that indicate impending issues. This allows maintenance teams to address problems proactively, preventing unplanned downtime and costly repairs. Implementing predictive maintenance helps optimize maintenance schedules, improve equipment reliability, and extend the lifespan of machinery. Ultimately, predictive maintenance can contribute to a significant OEE improvement by ensuring continuous, efficient production operations.
5. Invest in Real-Time Production Monitoring Software
Real-time production monitoring software provides instant visibility into production processes, allowing you to track performance metrics and identify bottlenecks swiftly. By measuring manufacturing productivity and equipment efficiency, this software enables data-driven decisions to optimize operations and reduce downtime. It supports 5 why root cause analysis, helping to implement strategies like automated data collection, focusing on top losses, and executing preventive and predictive maintenance. This comprehensive approach enhances overall productivity and drives significant improvements in OEE.
6. Set SMART Goals
Setting SMART (Specific, Measurable, Achievable, Relevant, Time-bound) goals is a useful tool for any endeavor. By defining clear and attainable objectives, you provide your team with a focused direction and measurable benchmarks. Specific goals help identify precise areas for improvement, while measurable criteria allow for tracking progress. Ensuring goals are achievable and relevant keeps them realistic and aligned with business priorities. Finally, time-bound deadlines create a sense of urgency and accountability, ensuring continuous progress and sustained improvements in operational efficiency.
7. Employee Training and Engagement
Effective employee training and engagement can help ensure everyone is on the same page. By providing comprehensive training on equipment operation, maintenance procedures, and data interpretation, you empower your workforce to perform their tasks more efficiently. Engaging employees in continuous improvement initiatives fosters a culture of ownership and accountability, encouraging them to identify and implement process improvements. Well-trained and motivated employees are more likely to adhere to best practices, reducing errors and contributing to overall operational excellence.
Focus on the Process or System
No matter what method you use for improving OEE, focus on the process/system and not on the person. Even if the root cause is people doing something wrong, focus on why a problem occurs and figure out how to change the system to prevent people from making that mistake.
You may have heard the Japanese term Poka-yoke, which means mistake proofing. Poka-Yoke is a technique used to make equipment or processes safer and more reliable by preventing inadvertent errors. There are many examples of mistake proofing that you see and use every day. For example, new cars are equipped with many monitoring and alert systems to warn of obstacles in your blind spots.
In a manufacturing facility, interlocks are in place to prevent machines from running when guards are open. This can be an effective tool to improve changeover time and eliminate startup defects. Making machine settings simple or even automatic so that changes are repeatable helps eliminate the opportunity for operator error.
Looking Ahead
There are several items mentioned in this and the other OEE blog posts that are key to improving OEE:
- Automate and collect accurate, real-time loss data
- Focus on the Six Big Losses
- Prioritize and develop an improvement plan
- Execute the plan using tools appropriate for each loss type
- Evaluate the results and adjust the plan to continuously improve
- Remember to involve operators in all stages
DataPARC has all of the tools to help you collect, analyze, and track your OEE data.
OEE: The Complete Guide
All the resources you need to successfully implement, analyze, & improve overall equipment effectiveness.