In the process industries, optimization is the key to efficiency. And efficiency is what leads to profit – allowing manufacturers to produce more and waste less. To optimize their processes, many manufacturers use a combination of time series data historian and data visualization software. dataPARC and PI are two of the leaders in this space, and in this article we’ll compare dataPARC vs PI and highlight some of the advantages dataPARC has over PI as a process information management system.
Check out dataPARC’s real-time process data analytics tools & see how better data can lead to better decisions.
dataPARC vs PI: Similarities
dataPARC and PI have existed for decades and have large installation bases represented by major manufacturers around the world.
Both dataPARC and PI:
- Offer a real-time data historian
- Use a binary, cluster-indexed, flat file to store history
- Have an asset structure to address the complexities of large disparate data sources
- Offer many of the expected analytics & visualization tools: trending, graphics, reports
- Can connect to various control systems for collecting time-series data in real-time
- Use a store & forward function in case data connectivity is lost
- Can work with very large tag-count systems
Now, let’s dive more into their differences and see how dataPARC sets itself apart.
dataPARC vs PI: Differences
Cost
We might as well start with what will be one of the key considerations when evaluating these two data historians and process data visualization toolkits.
Long story short, dataPARC’s total cost of ownership is lower when compared to other “like” industry solutions. Both the initial cost and ongoing costs are considerably lower than the PI System.
Unlimited Users
A key reason for this is dataPARC’s unlimited license model, which makes it a great fit for organizations wishing to get production data in front of decision-makers at every level of the plant without worrying about having to purchase additional licenses.
PI uses a per-user pricing model. This tends to work for small organizations with only a few people needing to access the platform, but for larger organizations or enterprise implementations, the cost adds up quickly.
With dataPARC, everyone who needs access to the data can have access at no additional cost – putting the power to make data-driven decisions in the hands of every employee.
Looking for an alternative to PI’s Data Historian? Get an enterprise plant data historian at a fraction of the cost. Check out the dataPARC Historian.
User Experience
When customers are asked about dataPARC’s top 3 to 5 benefits, ease-of-use is always near the top of the list. The reduced complexity of the dataPARC system allows even the least “computer-savvy” person to begin building content and gaining value, and results in wide adoption of the tools within an organization.
Though there are many features to dataPARC, a new user can learn how to search tags, trend, and navigate within minutes. From there, users quickly learn they can view trend statistics, manage alarm events, export data, create displays such as X/Y Plot, Histogram, or Pareto and much more all form the right-click menu.
dataPARC’s trending tools have long been recognized by customers as the number 1 trend solution in the industry. dataPARC’s trend capabilities are faster and far superior to others and fit better in the practical function realm.
No other package allows for a quicker build of a trend matrix, with quick drag & drop from both the tag browser and displays.
dataPARC makes finding and trending tag data super easy.
Many organizations that were set up with the PI Historian and ProcessBook have since chosen to get dataPARC to “sit on top” of their PI historian simply for PARCview; the visualization tools and ease of use speak for themselves.
Diagnostic Analytics
As mentioned earlier, dataPARC’s trending application is considered the best in industry. Not only for its ease of use and quick access to analysis tools but for its speed as well.
Trend
dataPARC uses a deliberate data speed strategy with multiple components including an embedded Performance Data Engine (PARCpde) to speed data to the user. The goal is to meet and exceed the user’s “speed of thought.” PARCpde is a foundational part of the entire dataPARC system.
Speed tests comparing dataPARC vs PI and other contemporary historians have shown dataPARC to be anywhere from 10X to 50X faster in delivering large or long-term datasets back to the user.
Several companies have switched to dataPARC in part because of the data speed. dataPARC also utilizes an aggregate archive and rollup archive in its architecture which greatly reduces the amount of time wasted when solving problems or investigating opportunities.
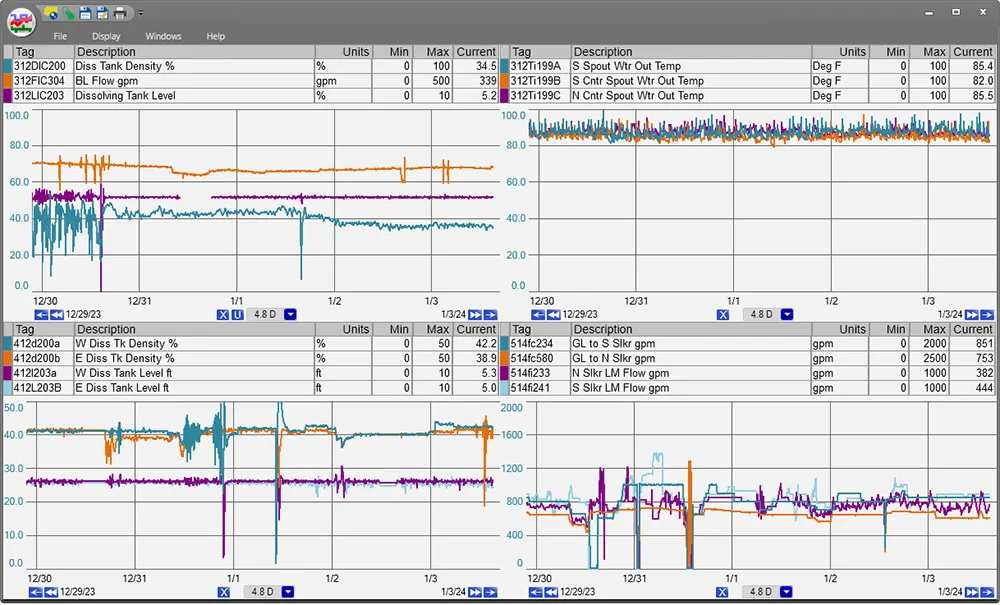
Multi-trends can be created ad hoc, no need to open a display to build. It is fast and convenient, save directly from the trend window.
From the trend, users can launch a quick statistics grid, generate a new X/Y Chart or Histogram display. Each chart will pull in the tags from the trend, so users don’t have search for them in Tag Browser again.
The X/Y plot sets two tags up for comparison and a best fit line can be generated – linear, polynomial, etc. The formula generated from the fit can be pulled into a trend or other display. PI can also generate X/Y plots, but they are created from scratch and no best fit line is generated.
Excel Add-in
dataPARC’s Excel add-in was built with a high degree of ease-of-use and speed.
PI’s PI DataLink and dataPARC’s Excel Add-in both have in-cell functions that can pull data directly into Excel. However, the dataPARC Excel Add-in has multiple other functions.
There is a sheet that can pull multiple tags in the same time range without dealing with formulas. Users can import tag lists from already created dataPARC displays instead of searching for the tags again.
Besides the value gained in legacy Excel add-in tools, dataPARC’s is highlighted by the following:
- Drag groups of tags/data into Excel from multiple data sources
- Filter data based on multiple tags values
- Cross Correlation/R2 matrix generation
- CUSUM & MSR charting
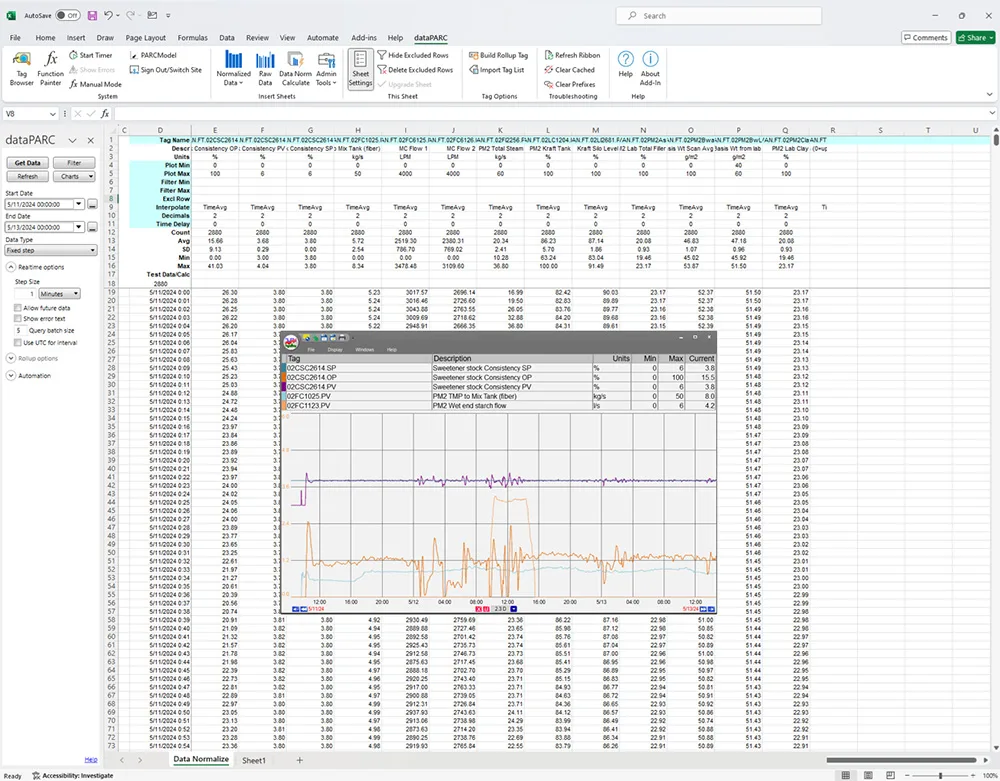
A dataPARC data normalization sheet, allowing users to see rows and rows of data without typing in equations to each cell.
Additionally, users can display time series-based data from Excel into PARCview trends and displays. This can be used to trend or compare data from outside the company right next to process data. And don’t worry if you have PI and are thinking about moving to dataPARC, all your PIDatalink, Displays and Asset Framework can be converted using our conversion tool.
Evaluate the top alternatives to Processbook & PI Vision in our PI Server Data Visualization Tools Buyer’s Guide.
Operations Management
Real-time operations management is necessary to keep a plant running at peak efficiency and to be able to respond quickly to process excursions that result in unplanned downtime or product loss.
This is facilitated by dataPARC in a variety of ways:
- Graphical process displays
- KPI and Lab data dashboards
- Manual data entry (MDE) tools
- Automated reporting
- Process alarms & notifications
- & more
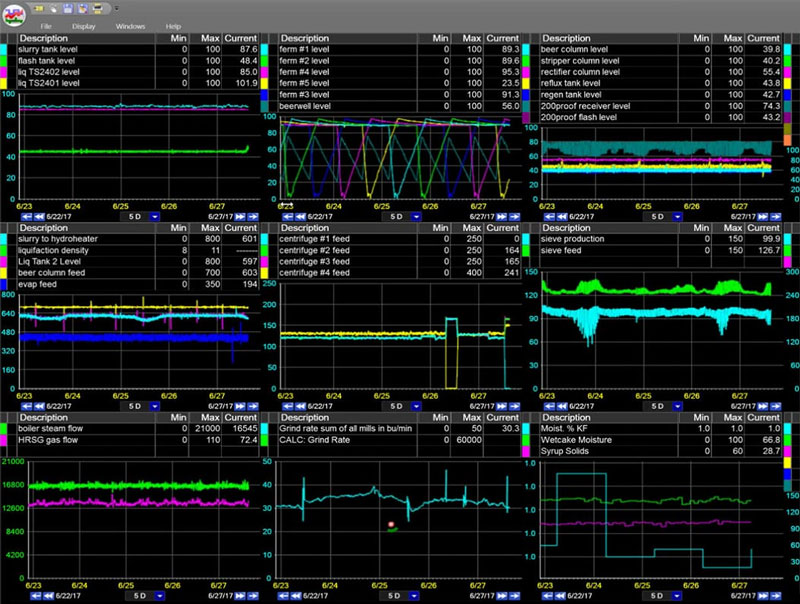
When comparing dataPARC vs PI, both offer the creation of dynamic, information packed graphical dashboards, but only dataPARC has the Centerline display.
Centerline
Centerline is a powerful monitoring tool unique to dataPARC. It is a real-time display that reports run based statistics for tags. The runs can be Grade or Time based, and the statistics include time average, standard deviation, CpK, min, max, etc.
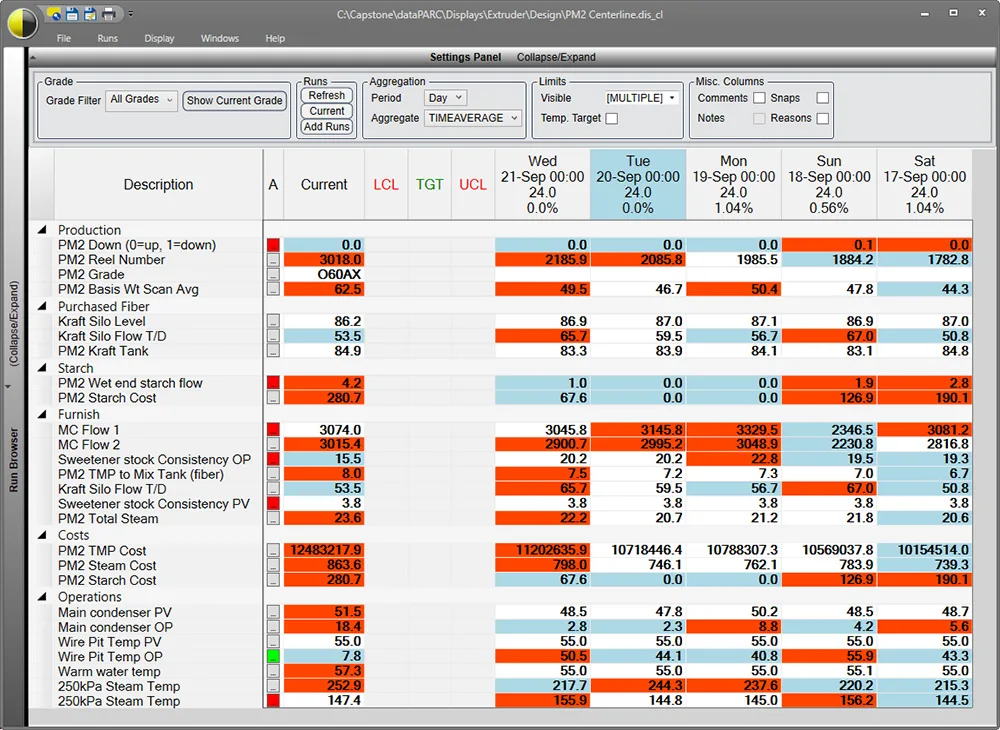
Centerline displays data for time periods or runs to ensure process conditions are the same run after run. When color options are enabled, they highlight values higher or lower than average.
The purpose of a centerline display is to help determine the best operational settings for production, and to ensure those settings are normally being used during production.
Centerline is one of dataPARC’s powerful data analysis tools for which there is no PI equivalent.
Alarms and Notifications
dataPARC’s alarm and notification system can send emails, text notifications or trigger workflows when an alarm is detected or closed. Once an alarm is detected, an alarm event is created. These events can be viewed and acknowledged in a trend, centerline, graphic or alarm list. Users can acknowledge the event by assigning a reason from the reason tree and/or typing a comment to the event. Quick analysis can be done in dataPARC with the Pareto chart to determine the top reasons saved for an alarm or create a tabular report sorted by reason with all comments visible.
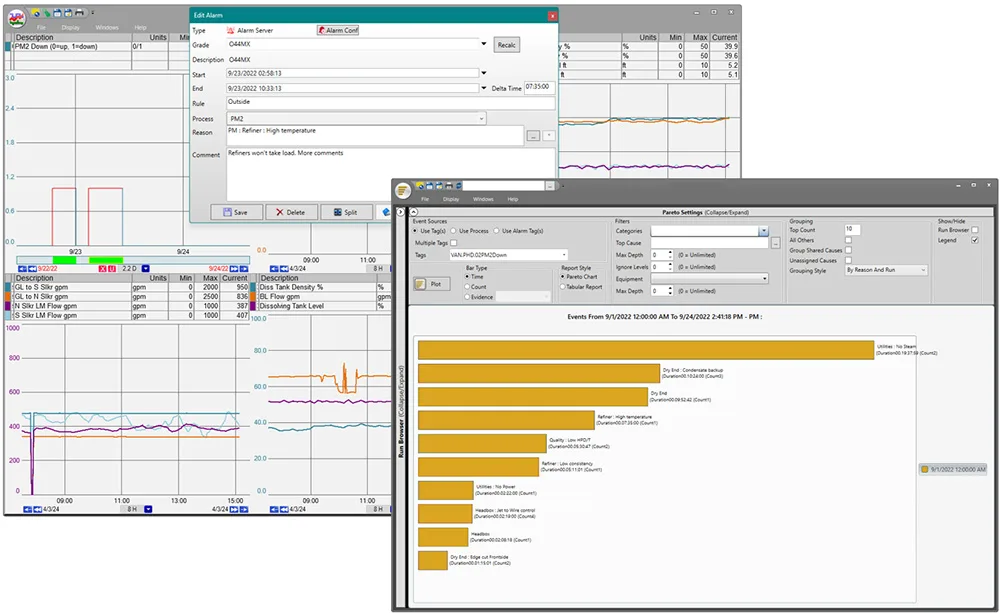
Interact with alarm events via trend, and quickly create a Pareto chart to help with root cause analysis.
Similarly, PI notifications can create event frames and send notifications. Once event frames are detected and a reason assigned, users can see this data as a table in PI Vision, but further analysis or reporting is required to take place in the PI Excel Add-in DataLink. dataPARC’s Excel Add-in also has features to pull in Alarm event data.
More dataPARC Excel Add-in features are explored in the following section.
Manual Data Entry (MDE)
dataPARC’s MDE display is quick to configure and allows users to enter and save manual data to the database rather than on a piece of paper or in Excel.
Manually entered data is represented by tags, thus they can be used in PARCview trends, dashboards, and displays like any other tag.
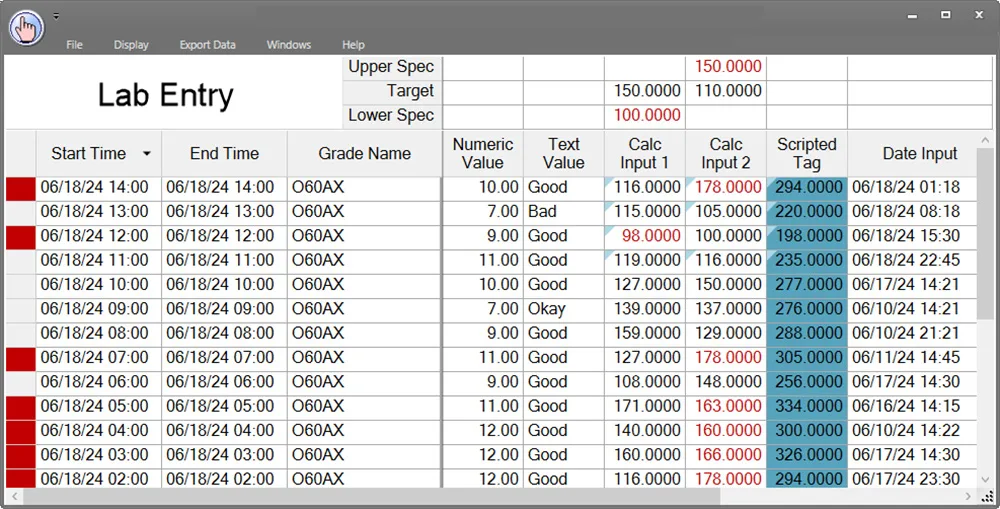
Lab data is now backed up in the database, and in the same place as your process data. Easily accessed and entered in one location with dataPARC.
Need to get better data into the hands of your process engineers? Check out our real-time process analytics tools & see how better data can lead to better decisions.
Calculations
When users don’t have the perfect tag to help manage a process, a calc tag or MDE is often used. dataPARC and PI are both able to perform simple calculations such as adding tags, If/Then statements, or unit conversions.
With PI Vision, PI Analytics no longer supports VB scripting. VB scripting opens the doors for custom solutions and dataPARC leverages VB scripting for applications such as database reads, file parsing, web service calls, and much more.
Asset Modeling
dataPARC’s Asset Hub and PI’s Asset Framework (AF) both offer ways to structure and contextualize time-series data by organizing tags around physical assets. While PI AF is powerful, it often requires more complex configuration using external tools and scripting. In contrast, Asset Hub is built with engineers and operators in mind, providing a more intuitive, point-and-click interface to build and maintain asset hierarchies without needing specialized training.
What sets Asset Hub apart is its tight integration with dataPARC’s trending, dashboards, and alarm tools. Users can quickly navigate from plant-wide views to individual assets and see real-time KPIs, historical trends, and performance limits in one place.
Web Access & Flexibility
When it comes to web access, PI System users are limited to PI Vision, a fully web-based tool. While it provides a centralized way to view data, it lacks a desktop counterpart, which can be limiting for users who prefer or require a more robust, locally installed application. Some of the shortcomings have been expressed in the previous sections, including calculations.
dataPARC offers both a full-featured desktop application (PARCview) and a browser-based version. This hybrid approach gives teams the flexibility to choose the best tool for the task, whether they’re in the control room, on a laptop, or working remotely.
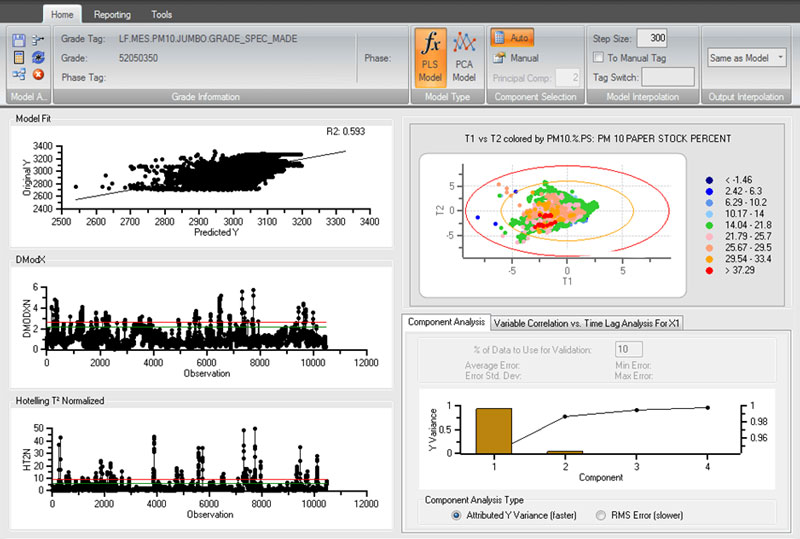
Predictive Analytics
dataPARC’s PARCmodel offers a degree of predictive analysis with PLS (Partial Least Squares) and PLC (Principal Component Analysis) modeling capabilities.
PLS
The PLS package has been described by one of the world’s top practical modeling engineers as “…bar-none, better than anything I’ve ever seen before.” In the processing industry, one of the applications for PLS modeling is in building inferential property predictors (IPPs).
Control engineers in operating companies report that a PLS model generation for one IPP can take more than 8 hours to re-model (longer for the initial model) using multiple tools and offline activity. dataPARC integrates it all into one tool and the re-model effort can be as little as 5 minutes.
This snappy model generation allows multiple solutions to be generated for comparison to find the best option. The speed of remodeling allows for wider application and benefit of PLS. Practical engineering methods and even process “hunches” can now be backed with a quick validation by a PLS mathematical session in 2 to 5 minutes.
dataPARC’s predictive modeling tools
dataPARC delivers huge time savings, better learning environment, better collaboration environment, more useful applications – these all accelerate value to the company’s key business drivers.
PCA
PCA uses the same modeling advantages that dataPARC’s PLS offers, allowing for easy model generation. The difference between the two modeling methods is that PLS seeks to model and mimic a single variable using adjacent variables as model inputs. PCA doesn’t model a single variable but models a whole process.
The value comes when comparing the current process with the modeled process. PCA gives the user the ability to know when the current process is off (when compared to the modeled process) and identifies the “offending” process variable(s).
PCA makes use of two parameters (available to the PLS model as well): DMODX (error from model) and HT2N (Hotelling T2 Normalized – off norm). The PCA model input variables are all graded and staff can see which variable(s) is/are causing the problem. PCA can be used as an early warning system to help operations see a problem before it happens.
PARCmodel is separately licensed but incorporated into PARCview and easily accessed in the trend right-click menu. PI does not have similar analytics tools.
Looking to replace ProcessBook? See why PARCview is regarded as the #1 ProcessBook alternative.
Customer-Centric Development & Support
At dataPARC, above everything is the customer and their very real, timely, practical needs. dataPARC’s strategy involves a high attentiveness to the customer’s needs and solving problems quickly.
dataPARC employs many SMEs serving in key process engineering support roles for operating companies in the industry. Over the years dataPARC’s user features and overall system architecture has been shaped by the SMEs and customers. dataPARC is built by end users for end users.
At dataPARC, we sell more than software; we sell our services to help build trends, graphics and other displays to get your system off the ground running. Our Engineers and Support staff are available to help implement new projects and off continual support.
With PI, to get the same displays created, customers would have to outsource to a 3rd party. dataPARC is a one stop shop.
Conclusion
dataPARC and PI have a lot in common, however dataPARC has the upper hand where it counts – user experience, speed of data, and cost. dataPARC is simple, fast, and effective.
The advantages to dataPARC vs PI continue to grow with every new feature and update. Features that are driven by users and customers.
Download the Guide
Discover top alternatives to PI’s ProcessBook and PI Vision analytics toolkits.