Unlocking the full potential of your Wonderware Historian requires powerful visualization and analytics tools that can transform raw plant data into actionable insights. As a legacy historian, Wonderware has undergone rebranding under AVEVA as the AVEVA Historian. If you’re currently using the legacy Wonderware Historian, you may be seeking advanced visualization and analytics solutions to harness the true value of your plant data. In this blog post, we dive into the seamless integration and exceptional visualization capabilities offered by dataPARC’s PARCview. Discover how PARCview can empower you to unlock the hidden potential of your Wonderware Historian and gain valuable insights that drive operational excellence.
Enterprise data historian functionality at a fraction of the cost.
Learn MoreWonderware Historian has solidified its position as a trusted data historian solution in the manufacturing industry. It enables organizations to capture, store, and analyze vital process data. However, organizations often require advanced visualization tools to fully harness the power of this data and transform it into actionable insights.
This is where PARCview offers a remarkable solution that seamlessly integrates with Wonderware Historian. With PARCview’s cutting-edge capabilities, organizations can visualize their data in ways never seen before. PARCview empowers users to make informed decisions and drive operational excellence. Say goodbye to static data and embrace the dynamic visualization revolution with PARCview.
Maximizing Your Wonderware Historian with Data Visualization
Maximizing the potential of your Wonderware Historian requires more than just data storage. Without robust visualization software, accessing and leveraging your data becomes a daunting challenge.
While the AVEVA suite provides options, it’s crucial to evaluate if they truly meet your requirements carefully. Making data-driven decisions becomes nearly impossible when you lack easy access to your data. So, selecting the right solution involves a comprehensive assessment of several factors.
First and foremost, seamless integration with the historian is essential. You need a solution that effortlessly connects to your Wonderware Historian, ensuring smooth data flow and accessibility.
Additionally, consider factors such as data access, scalability, performance, and reliable customer support. It’s important to evaluate the overall cost of ownership over the long term, including considerations like subscription services, user-based pricing models, or tag count limits.
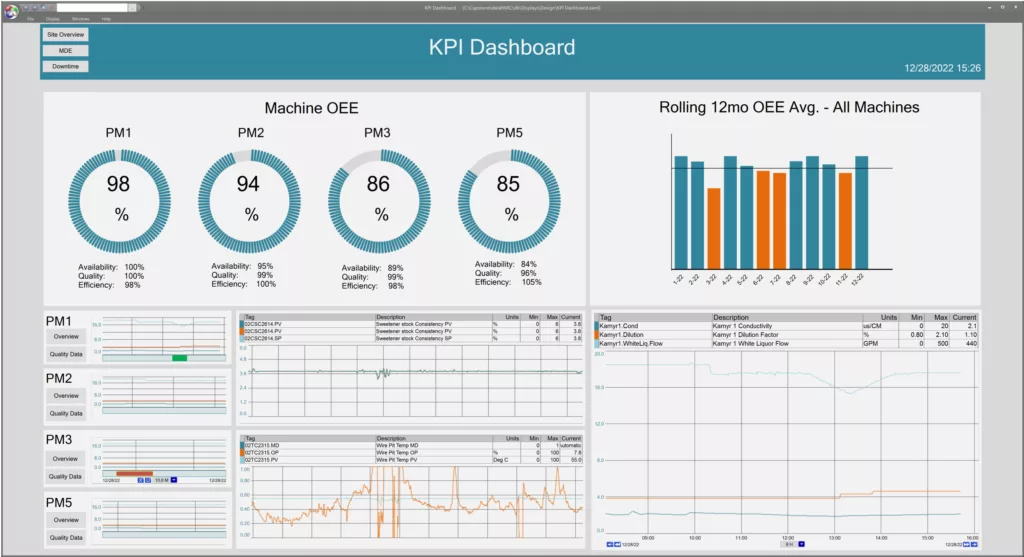
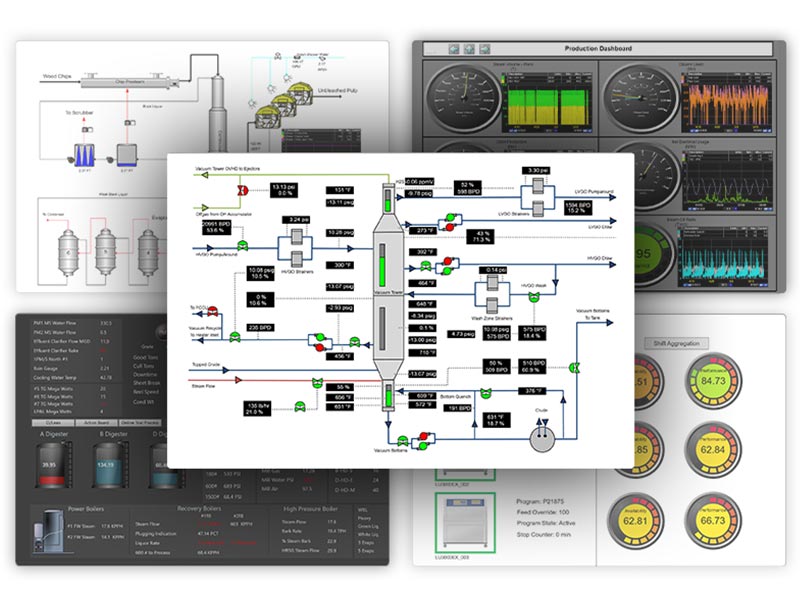
PARCview’s graphical display with embedded trends offers a comprehensive view of process data, enabling real-time production monitoring and analysis of key performance indicators.
Of course, the ability to visualize and analyze data is paramount. Look for tools that offer trending capabilities, diagnostic analytics, and advanced visualization options. This allows you to derive meaningful insights, identify trends and patterns, and comprehensively understand your data.
When it comes to the best tool for the job, look no further than dataPARC’s PARCview. PARCview empowers organizations to make informed decisions by seamlessly integrating Wonderware Historian. It offers a user-friendly interface, comprehensive visualization capabilities, and advanced analytics tools. With PARCview, you can optimize your operations and unlock valuable insights.
In the next section, we will investigate each of these critical aspects, exploring how PARCview exceeds expectations and delivers unmatched value. By selecting PARCview, organizations can confidently embrace data-driven decision-making and unlock the full potential of their Wonderware Historian.
Mastering Manufacturing Metrics: The ultimate guide to establishing, measuring, & reporting KPIs for peak plant performance.
Visualize Wonderware Historian Data with PARCview
PARCview is the ultimate data visualization tool specifically designed to complement a variety of Historians, including the Wonderware Historian.
With its enhanced visualization, analysis, and reporting capabilities, PARCview takes data visualization to new heights, allowing Wonderware Historian users to extract valuable insights and make informed decisions. Let’s explore the exceptional capabilities that make PARCview the best visualization tool for Wonderware Historian users.
Seamless Integration with Wonderware Historian
PARCview seamlessly integrates with Wonderware Historian, eliminating the need for manual data transfers or complex data mapping processes.
This integration enables users to effortlessly access and visualize their historical data stored in Wonderware Historian within the PARCview platform. By providing a unified view of data from multiple sources, PARCview ensures data consistency and enables users to gain comprehensive insights into their processes.
Moreover, PARCview allows for real-time data visualization, allowing users to monitor live data streams, track process variables, and make real-time decisions based on up-to-date information.
Scalability and Performance Capabilities
PARCview is designed to handle the high volumes of data generated by industrial processes, making it a scalable solution for Wonderware Historian users.
With its Performance Data Engine, PARCview efficiently stores time average aggregates, including daily, hourly, and minute averages, optimizing trend performance over longer timespans. Unlike other visualization tools that may take minutes to trend five years of data, PARCview accomplishes this in a matter of seconds.
Additionally, PARCview offers configuration options to save run-based statistics such as time average and standard deviation, which are leveraged across multiple display types.
These features ensure that PARCview delivers fast and efficient data visualization, even with large datasets. Users can explore and analyze data from various Wonderware Historian tags, time ranges, and plant areas without compromising performance, enabling them to derive valuable insights effectively.
Easy-to-use Interface
The PARCview interface is intuitively designed to facilitate effortless navigation, visualization, and data analysis from any source. With drag-and-drop and right-click functionality, users can easily create customized trends and dashboards tailored to their specific needs.
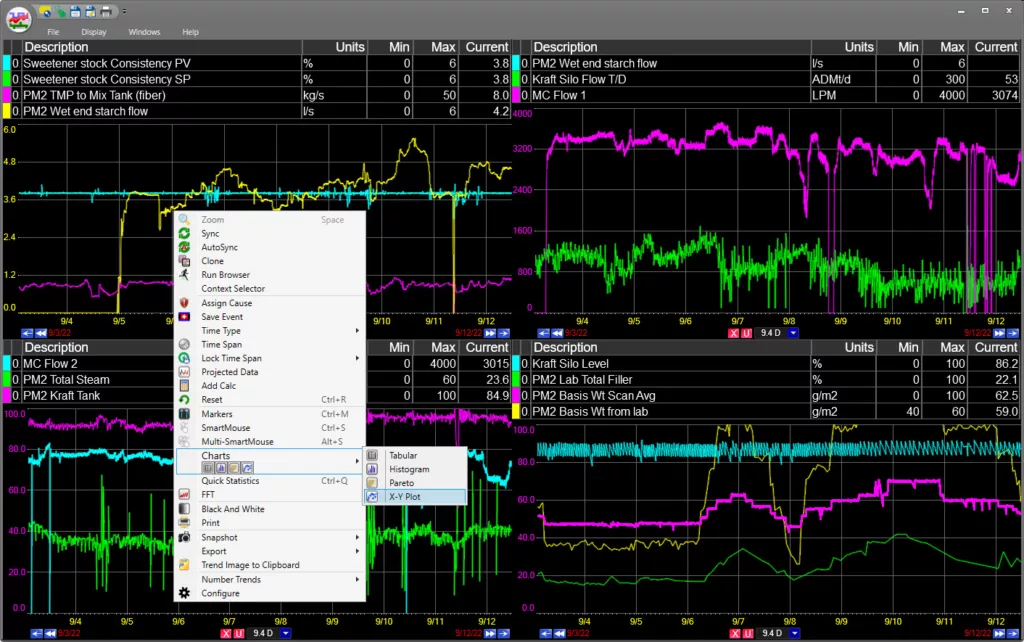
PARCview Trend shows the multiple options available in the right-click menu of a trend display.
PARCview’s interactive trend features, such as zooming, panning, and filtering, enable users to focus on specific data points and delve deeper into the analysis. Whether a user possesses technical expertise or not, the user-friendly interface empowers everyone to extract data quickly.
Advanced Analytics
PARCview offers advanced analytics capabilities that elevate the visualization and analysis of Wonderware Historian data. Users can leverage various analytical tools, such as XY displays with best-fit lines and statistical process control (SPC), to gain deeper insights, detect anomalies, predict future behavior, and optimize process performance.
PARCview integrates data modeling for predictive analytics and anomaly detection, enabling users to go beyond basic visualization and unlock the full potential of their data. By applying advanced analytics to Wonderware Historian data, users can make data-driven decisions and drive continuous improvement initiatives.
Export Data with Ease
PARCview provides seamless options for exporting data for further analysis. Users can export data directly from trends in various formats, such as CSV or Excel, with the ability to select specific column headers to include.
This feature allows for quick data formats that can be easily copied into programs like Minitab without requiring additional data manipulation. The ability to export data effortlessly from PARCview simplifies data sharing, report generation, additional analysis, and integration with other systems.
Moreover, PARCview offers data export scheduling. Users can automate data export tasks based on specific criteria or time intervals, streamlining data distribution and reporting processes.
Final Thoughts
The true power of Wonderware Historian lies in its ability to capture critical process data, but it’s the right visualization tool that truly unlocks its full potential. Regarding visualization solutions for Wonderware Historian, PARCview stands out as a game-changer. With its seamless integration, user-friendly interface, and data export capabilities, PARCview empowers manufacturing companies to extract valuable insights like never before.
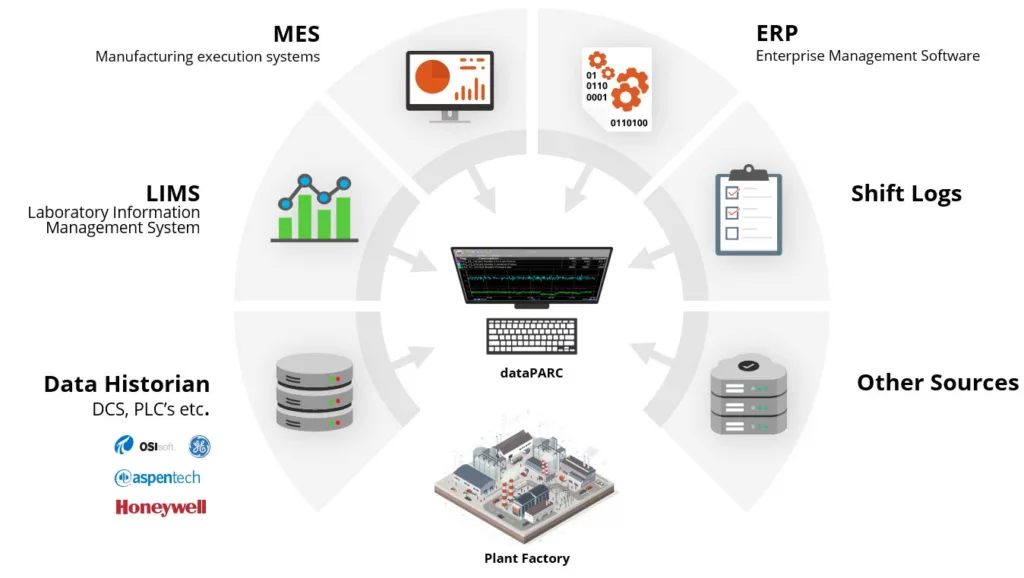
dataPARC’s seamless integration with a variety of Historians, including Wonderware.
PARCview’s strength lies in its ability to seamlessly integrate with Wonderware Historian, providing enhanced visualization that goes beyond raw data. From real-time data streams to historical trends and alarms, PARCview offers a comprehensive and unified view of your data. With this holistic perspective, organizations can gain a deeper understanding of their processes, identify patterns and trends, and uncover hidden opportunities for optimization.
Scalability is another key feature of PARCview. It can effortlessly handle the immense volumes of data generated by industrial processes. Its Performance Data Engine ensures fast trend performance over extended time spans
User experience is paramount, and PARCview excels in this aspect. Its user-friendly interface enables effortless navigation, customization, and analysis of data from any source. PARCview empowers users of all technical backgrounds to extract valuable insights from their Wonderware Historian data efficiently.
Advanced analytics take visualization to the next level, and PARCview delivers on this front as well. By applying advanced analytics, companies can proactively identify trends, detect anomalies, and make informed decisions for continuous improvement.
Effortless data export is a crucial aspect of any visualization tool, and PARCview doesn’t disappoint. With its flexible export options, users can seamlessly export data in various formats for further analysis or integration with other systems.
PARCview is the ultimate visualization tool for Wonderware Historian users. By embracing PARCview, manufacturing companies can unleash the true potential of their Wonderware Historian data. Gain valuable insights, optimize your processes, and drive operational excellence. Take the next step and elevate your data visualization experience with PARCview today.
Thinking about an Industrial Data Platform? Let our Smart Factory guide your way.
FAQ: Wonderware Visualization
- What makes PARCview the best visualization tool for Wonderware Historian?
PARCview offers several advantages: seamless integration with Wonderware Historian so you don’t have to manually move or map data; high performance even over very large historical data sets, thanks to its Performance Data Engine; an intuitive, drag-and-drop interface with right-click menus, zooming, panning, filtering; advanced analytics like SPC, anomaly detection, and XY displays; plus easy data-export options. - How fast is PARCview when working with long time ranges (e.g. years) or many tags?
Very fast. PARCview’s performance engine handles large volumes of data efficiently, using aggregated statistics (minute, hourly, daily averages) and summarization so that even long-span trends can be displayed in seconds instead of minutes. - What level of user skill or training is needed to use PARCview well?
The interface is designed to be user-friendly. Features like drag-and-drop of tags, right-click menus, interactive trend zooming and filtering make it usable for engineers and operators, not just data scientists. Some training will help in exploring advanced analytics or dashboards, but many users can get started with basic trend/visualization tasks fairly quickly. - Does PARCview scale well across multiple plants or for enterprise-wide deployments?
Yes. It’s built to handle high data volumes, many tags, and multiple sources. Whether you’re visualizing data at a single Wonderware Historian or across many sites, PARCview is meant to maintain performance and consistency.
Building The Smart Factory
A Guide to Technology and Software in Manufacturing for a Data-Drive Plant


