In the dynamic landscape of process industries, staying ahead of the competition requires robust data visualization tools that empower organizations to make informed decisions and optimize operations. While aspenONE Process Explorer has been a trusted solution, industry demands for more advanced features and capabilities have paved the way for alternatives. In this blog post, we will explore the exciting realm of aspenONE replacements, unveiling cutting-edge solutions such as PARCview that revolutionize data visualization and unlock new possibilities for process industries. Join us as we embark on this transformative journey toward enhanced data visualization and operational excellence.
Build Real-Time Dashboards & Displays for Effective Process Monitoring with dataPARC
Data visualization plays a pivotal role in driving informed decision-making and optimizing operations in manufacturing.
As organizations seek advanced solutions to extract valuable insights from their data, it becomes crucial to explore alternatives that go beyond the capabilities of existing tools when possible.
aspenONE Process Explorer has provided valuable insights to industry professionals, shedding light on the data-driven landscape. However, visualization options, data analysis flexibility, and scalability limitations have been observed.
Companies will have their own specific reasons for searching for an aspenONE replacement visualization tool.
PARCview as an aspenONE Replacement
PARCview is a cutting-edge data visualization solution that transforms process industries’ data analysis and interpretation.
It is intuitive and has a comprehensive set of features and advanced capabilities. PARCview offers a powerful alternative as an aspenONE replacement.
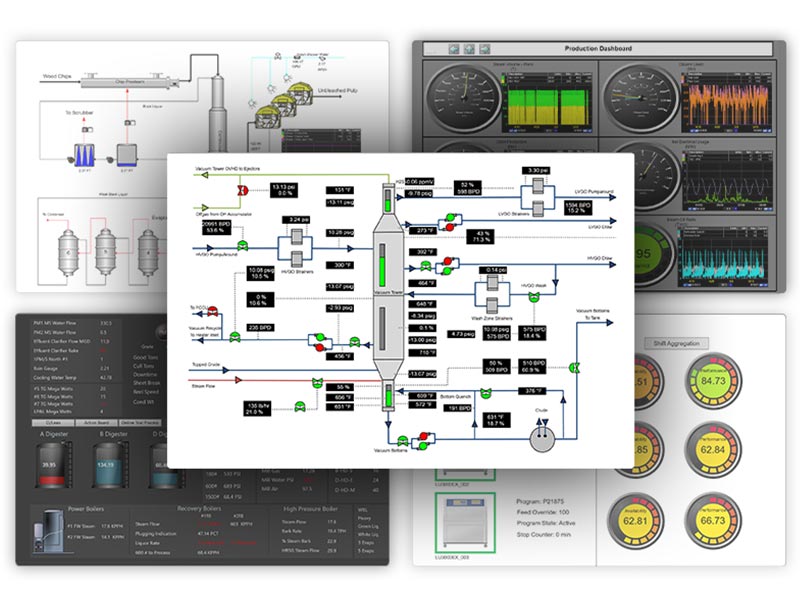
PARCview provides users with various tools and techniques to create visually compelling representations of their process data. From interactive multi-trends to sophisticated dashboards, PARCview empowers users to gain deeper insights and make informed decisions.
A sample of an interactive PARCview Graphic with a variety of trends, buttons, and controls.
Here are a few reasons one might choose to shift to PARCview for their data visualization:
Intuitive, User-friendly interface
PARCview prides itself on its intuitive and user-friendly interface. It is accessible to users of all experiences and technical backgrounds.
Anecdotally, when users are introduced to PARCview and other visualization software, they can view current dashboards, create new trends, and navigate trends more quickly with PARCview.
Trends are easy to create independently, allowing for fast data exploration and the ability to find the root cause. Drag-and-drop allows tags to easily be added from one trend or displayed to another.
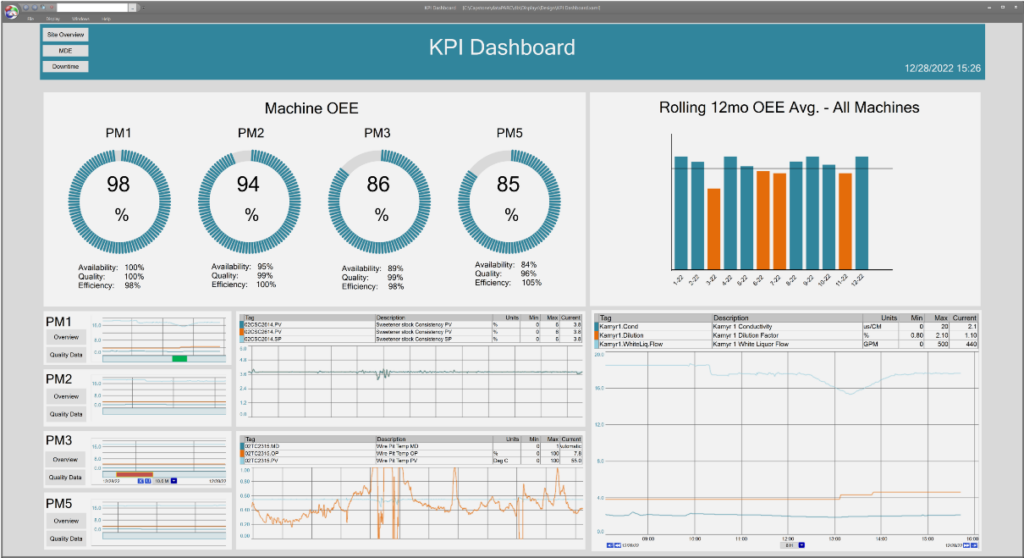
PARCview Graphics (dashboards) can be created as standard information dashboards, process overviews or even their own interactive applications by using VB.NET. This eliminates the limitations and enables effortless data exploration and interpretation, empowering end-users to derive actionable insights.
Visualization Options
PARCview goes beyond basic visualizations and offers advanced techniques to analyze and present process data. A standard across visualization software is a trend, but PARCview is the #1 Trending Display on the market.
There are a few reasons for this. First, PARCview trends are independent displays; a new graphic/dashboard must not be created to save a trend. Additionally, a multi-trend can be created within a trend display.
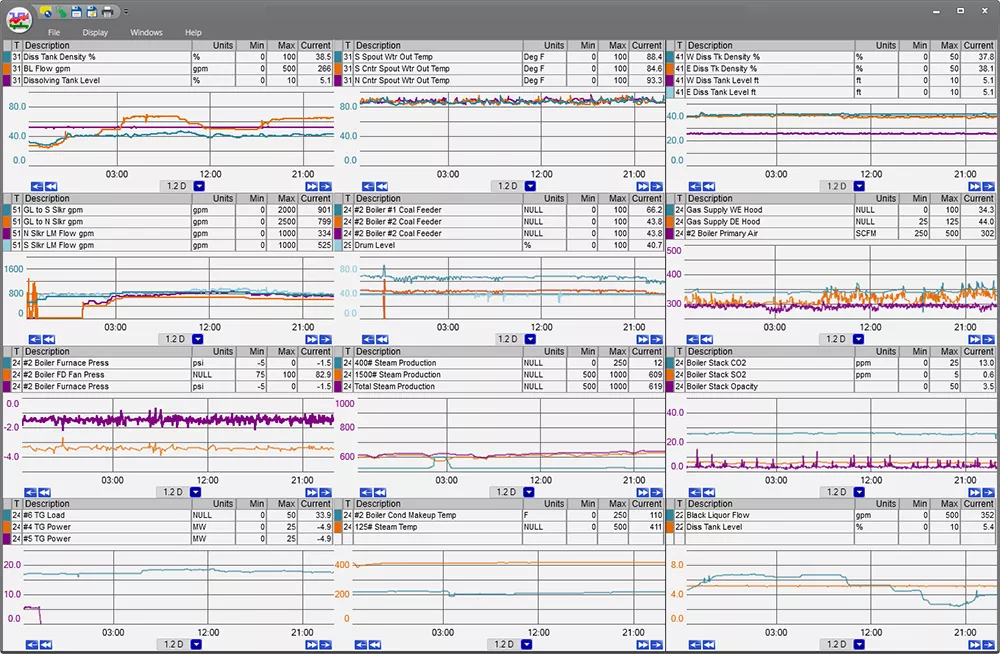
This image is of a PARCview multi-trend display with 9 trends in one. They can navigate independently or together.
This allows users to see 5, 10, 20, or more separate trends on a single display. Users can sync the time together and view data side by side without having to deal with multiple windows or creating customized dashboards specifically for trending.
Centerline utilizes Run Browser, allowing users to view data in group runs. These runs can be time period, grade, product, or tag value such as vendor.
Centerlining ensures that the best settings and procedures are in place during production to show that the process is running consistently, producing a consistent, high-quality product. Easy access to grade-specific or product-specific centerline settings and ranges is critical if multiple grades or products are being produced.
Users can also leverage XY plots, histograms, Pareto charts, and more to uncover patterns, anomalies, and correlations in their data. Such tools assist in providing a comprehensive understanding of process performance and identifying root causes.
Mastering Manufacturing Metrics: The ultimate guide to establishing, measuring, & reporting KPIs for peak plant performance.
Advanced Analytics
PARCview incorporates advanced analytics and diagnostic tools that enable users to perform in-depth analysis on their process data. From statistical process control (SPC) to predictive analytics and anomaly detection, PARCview equips organizations with the tools to optimize their processes and identify areas for improvement.
Rather than having a separate Lab Management System where specifications are kept, with PARCview users can maintain specifications in the same places as visualizing the data. Lab data can also be entered into PARCview.
PARCview’s PLS package has been described as unparalleled, surpassing any other solution available. PLS modeling plays a crucial role in building predictors, but the conventional approach involves time-consuming processes using multiple tools.
With dataPARC, everything is integrated into a single tool, reducing the re-modeling effort from over 8 hours to as little as 5 minutes.
Additionally, dataPARC’s PLS and PCA offer similar modeling advantages, with PLS focusing on mimicking a single variable using adjacent variables, while PCA facilitates easy model generation.
Data Performance
dataPARC prioritizes data performance with a strategic approach, leveraging multiple components, including the embedded Performance Data Engine (PARCpde), to accelerate user data delivery.
The ultimate objective is to provide users with data at the “speed of thought” by providing instantaneous access to critical information. The PARCpde is a foundational element within the dataPARC system, contributing to its overall efficiency.
Speed tests comparing dataPARC to other tools have consistently demonstrated dataPARC’s superiority, delivering data to users anywhere from 10X to 50X faster.
Numerous companies have switched to PARCview, partly due to its exceptional data speed capabilities. Additionally, dataPARC incorporates an aggregate archive and rollup archive in its architecture, effectively minimizing the time wasted during problem-solving or opportunity investigation.
Seamless integration with current data sources
PARCview seamlessly integrates with a user’s current historians and data sources. Data can be consolidated from various systems into a single, unified platform.
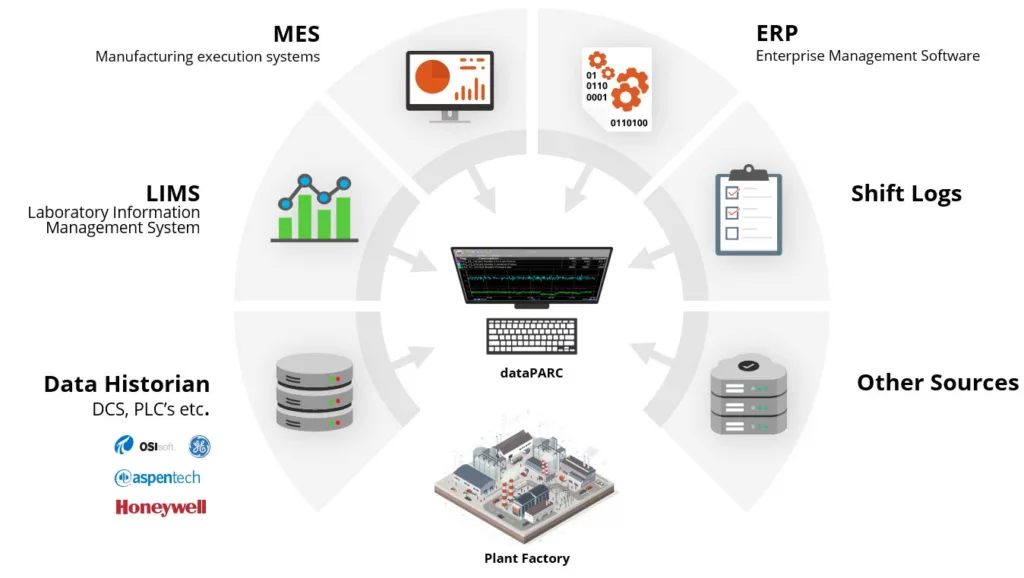
Connect, aggregate, and integrate your data for a single source of truth.
This integration ensures data consistency and a single source of truth. When the entire process can be seen on one system, end-users are more informed and can make data-driven decisions.
Other aspenONE Replacements
While of course,e we think PARCview is the right option as an aspenONE replacement, here are a few more to take a look at:
Canary:
Canary is a data visualization and analytics software specifically designed for the process industries. It offers real-time monitoring, advanced analytics, and reporting features.
While Canary doesn’t have a dedicated module to connect to other Historians, it offers easy integration with process data sources through OPC DA and OPC UA. It has browser-based trending and basic diagnostic analysis capabilities, along with an Excel Add-in for more advanced analysis.
However, users seeking dynamic and interactive display building may need to explore other options. Canary’s pricing structure is transparent and includes both one-time and monthly fees.
TrendMiner:
TrendMiner offers easy integration with other historians. While it excels in trending and diagnostic analysis, including features like tag browsing, trend overlays, and data filtering, users have reported challenges in utilizing the system for root cause analysis and slow performance.
TrendMiner provides monitoring capabilities and smart alarming. The platform also offers advanced analytics capabilities through predictive models based on historical data. Pricing for TrendMiner is customized based on specific use cases and tends to be higher than other alternatives.
PI Vision:
PI Vision, another alternative to aspenONE Process Explorer, seamlessly integrates with the OSIsoft PI System, offering organizations a unified platform to connect and access their data.
It provides a range of visualization tools that enable users to create interactive displays and graphical representations of data. While PI Vision’s advanced analytics capabilities have evolved, it doesn’t offer an Excel Add-in for data extraction.
It is also a fully web-based interface now that ProcessBook is no longer being supported.
Conclusion on aspenONE Replacements
aspenONE Process Explorer has been a valuable tool in the process industries, providing insights into the data-driven landscape. Some may seek an aspenONE replacement, looking for something with fewer limitations.
PARCview emerges as a cutting-edge data visualization solution, offering comprehensive features and advanced capabilities.
PARCview’s intuitive and user-friendly interface empowers users of all technical backgrounds to explore and interpret their data effortlessly. With advanced visualization options, including multi-trends and centerlining, users can gain deeper insights and identify root causes more effectively.
While other options exist for an aspenONE replacement, such as Seeq, Canary, TrendMiner, and PI Vision, PARCview stands out as the preferred choice for organizations seeking an advanced data visualization solution. Its unique features, exceptional performance, and ease of use have led numerous companies to make the switch to PARCview.
In the ever-evolving landscape of process industries, unlocking the full potential of data visualization is essential for driving informed decision-making and optimizing operations.
With PARCview, organizations can elevate their data visualization experience, derive valuable insights, and take their processes to new heights of efficiency and productivity. Embrace the power of PARCview and revolutionize your data visualization journey today.
FAQ: aspenONE Replacement
- Can the replacement tool integrate with my current data historian(s) or existing data sources?
Yes. Any strong alternative should connect to your current historians, OPC DA/UA sources, SQL/ODBC databases, lab data, and other process data sources. Tools like PARCview are built to aggregate and unify data from multiple sources so you can have one “single source of truth.” - What kind of visualization capabilities should I expect beyond what aspenONE provides?
Beyond basic trending, strong alternatives offer interactive multi-trend displays (dozens of trends in one view), synchronized time axes, XY and histogram plots, Pareto charts, centerlining (for quality consistency across product grades), and advanced analytics tools like predictive models, SPC, and anomaly detection. dataPARC tools offer these options. - What is the best software to upgrade to from aspenONE?
The best replacement for aspenONE is dataPARC’s PARCview. It delivers superior performance, intuitive dashboards, advanced visualization tools, powerful analytics, and seamless integration with multiple data sources, making it the leading choice for manufacturers who want to move beyond the limitations of aspenONE. - How scalable is the replacement across multiple plants or global operations?
Solutions like dataPARC are built to scale from a single site to enterprise-wide deployments. With tag-based licensing, unlimited users across different plants can access the same data environment without driving up costs. This makes it easy to standardize dashboards, KPIs, and reports globally while still giving each site the flexibility to configure views and analytics for their specific needs.
Building The Smart Factory
A Guide to Technology and Software in Manufacturing for a Data-Drive Plant