Overall Equipment Effectiveness (OEE) is a manufacturing performance metric that is used to identify lost opportunities and measure improvement efforts.The OEE calculation formula combines an uptime, performance score and quality into a single metric.

Everything you need to successfully calculate, analyze, & improve overall equipment effectiveness.
What is OEE?
Overall Equipment Effectiveness (OEE) is a critical metric in the manufacturing process. It determines how well your process is running based on three key attributes. OEE focuses on how much quality product is produced compared to how much should have been produced within a given timeframe. It also takes into consideration the asset availability as well as the asset performance speed. Essentially, OEE measures the percentage of time that is actually productive, incorporating three main components: availability, performance, and quality.
Availability measures the percentage of scheduled time that the equipment is available to operate. Performance assesses whether the equipment is running at its maximum speed. While quality evaluates the percentage of good parts produced versus the total parts produced.
Understanding and optimizing OEE is key for identifying inefficiencies, benchmarking performance, and guiding continuous improvement efforts in production processes. By accurately measuring and implementing OEE, manufacturers can gain insights into their operations. They are able to pinpoint areas for improvement and implement strategies to enhance overall manufacturing efficiency and productivity.
OEE Calculation Formula
Building on the understanding of OEE, we can delve into the OEE calculation formula. Part of OEE determines how much quality product is produced compared to how much should have been produced within a given time frame.
As we learned earlier, the OEE formula is calculated by multiplying three factors measuring manufacturing productivity together: availability, performance, and quality. Each of these components plays an important role in accurately measuring and understanding overall equipment effectiveness, providing valuable insights for improving production processes and overall efficiency. The OEE formula is calculated by multiplying these three factors together:

However, each of these variables is a calculation in itself. They can be broken down as follows:
Availability

Availability is really the uptime divided by the available time. The Uptime is any available time with the unplanned downtime removed. Planned production downtime does not go against the OEE value.
Unplanned downtime includes changeovers, equipment failures and breakdowns. Available time excludes events that are beyond the control of the operations team, like power outages or production curtailments. Every company has different criteria for calculating available time, but the important thing is to be consistent and always calculate it the same way. Let’s look at an example for one day:
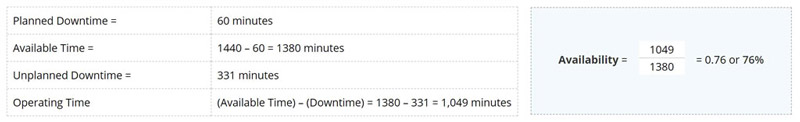
Here is a breakdown of the availability calculation needed for the overall equipment effectiveness calculation.
Performance
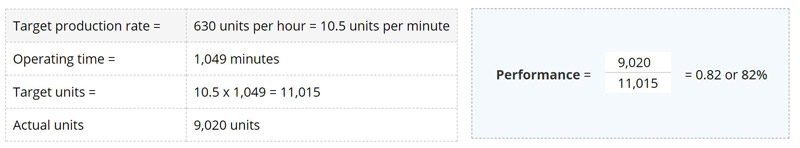
The performance factor of OEE shows how well a machine runs by measuring the speed loss that occurs during operating time. Traditionally, the performance factor is calculated on a time basis.

The ideal cycle time for production process is the time it should take to produce one unit. A simpler way to calculate the performance factor is to compare the actual quantity produced to the target production rate.

Both equations will give the same percentage result, but using production units instead of time is easier for everyone to understand. Here is an example performance factor calculation:
Quality
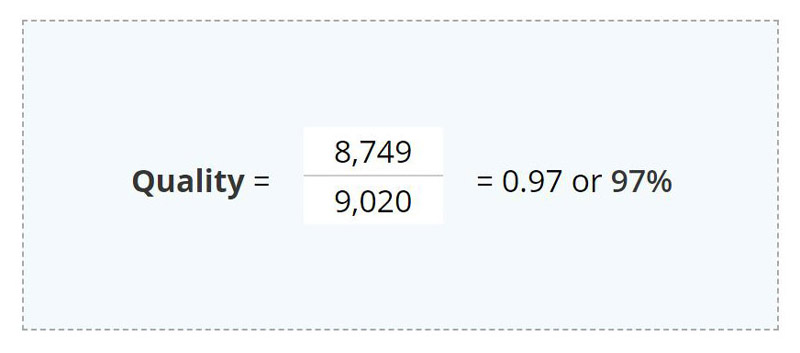
Not all products that are produced meet the quality specifications. The quality factor accounts for quality losses by comparing the number of good units to the total number of units produced.

Here is a quick quality oee calculation example. If there were 8,749 good units, the quality factor is calculated as follows:
How To Calculate OEE
There are different ways to calculate overall equipment effectiveness, but we will focus on the basic OEE calculation formula for this blog. The basic OEE calculation formula involves multiplying three factors together: availability, performance, and quality. This method provides a comprehensive measure of how effectively equipment is utilized.
Additionally, there is the top-level OEE calculation, which simplifies the process by directly considering good units produced, ideal cycle time, and amount to planned production time. While both methods offer valuable insights, the basic OEE calculation formula is commonly used for its detailed breakdown of each component.
Once each of the factors (Availability, Performance, and Quality) have been calculated, they can be multiplied to determine the OEE. Using the values from the above examples:
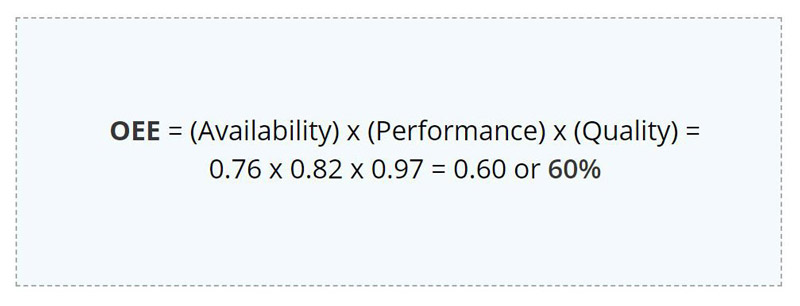
Although each of the individual parameters may seem acceptable on its own, the manufacturing process is only producing quality products 60% of the time. This seems rather low doesn’t it? Actually, 60% is a typical OEE value for manufacturing operations and values under 50% are quite common. However, OEE is not meant for comparing different processes, or even similar processes with different circumstances. The following example illustrates the problem with OEE comparisons.
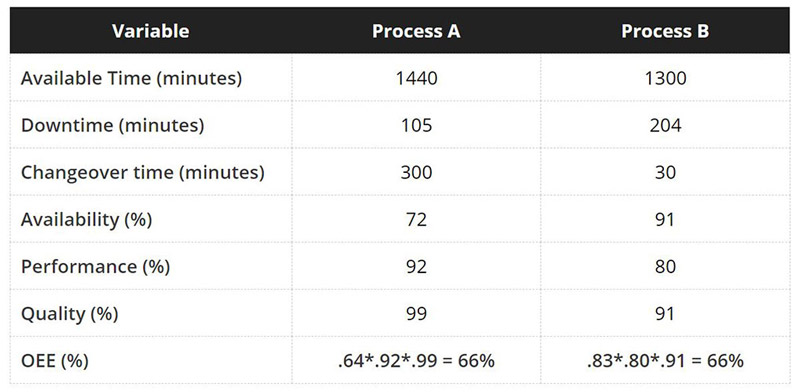
Both Process A and Process B have an OEE of 66%, but which one would you rather have? Process A has a lot of changeover time from product changes, but when it is running, it runs well. They could benefit from setup reduction or improved production scheduling.
On the other hand, Process B has a much higher availability score because there is much less changeover time, but would you like to have 91% quality instead of 99% like Process A?
You can see that there are many ways to get the same OEE, so care must be taken when making OEE comparisons. The power of OEE comes from analyzing the losses, not the resulting OEE score.
Challenges in Utilzing the OEE Calculation Formula
Calculating overall equipment effectiveness accurately can be challenging due to several common issues:
- Data Accuracy: Inaccurate data collection can lead to incorrect OEE calculations. Ensuring reliable data sources and consistent data entry is crucial. This can also include things like excluding very short stops, but these add up over time. Each manufacturing process will have different challenges when it comes to data accuracy.
- Downtime Categorization: Misclassifying downtime events or failing to capture all instances can skew OEE results. Clear definitions or reasons and enabling categorization are essential.
- Performance Metrics: Inconsistent or unrealistic performance benchmarks can distort OEE calculations. It’s important to set and maintain accurate performance standards.
- Complex Production Processes: For complex manufacturing processes, capturing all relevant data points can be difficult. Simplifying data collection and focus on measuring key performance indicators.
By addressing these common issues, manufacturers can improve the accuracy of their OEE calculations and gain better insights into their operational efficiency.
Calculate, report, & analyze production loss from downtime, lost opportunities, and process slowdowns.
Best Practices for Reliable OEE Tracking
The OEE calculation formula is standard, but collecting the right values is anything but. Every facility is different and has different data collection needs. By keeping the challenges of OEE calculation in mind, companies can check their tracking and ensure accurate data from the start.
When using OEE, it is important to have a simple and flexible way to collect data and track downtime, speed, and quality losses so action can be taken on the operating floor. Automatic event tracking with real-time displays can help operators log information and take corrective actions in a timely manner.
Dedicated OEE software, or a combination of a data historian and data visualization tools, can be used to track and analyze production losses and calculate OEE.
Tracking Quality
dataPARC enables users to perform routine quality checks and integrates lab data to ensure accurate measurement of defects and rework. This helps the site capture an accurate quality score. Additionally, dataPARC supports manual data entry, allowing operators to input quality metrics directly into the system. This ensures that all quality data, whether automated or manually collected, is accurately captured.
By integrating quality data with process data, dataPARC provides a comprehensive view of production performance, enabling better decision-making and more effective quality control measures. This holistic approach ensures that quality issues are identified and addressed promptly, maintaining high standards of product quality.
Collecting Performance Data
Data historians play a crucial role in collecting and storing performance data over time. This powerful tool ensures that all production data is accurately captured and easily retrievable for analysis. Real-time performance metrics are captured using dataPARC’s visualization tools, allowing for the monitoring of production speed and identification of slow cycles.
The dataPARC historian integrates seamlessly with these tools, providing a comprehensive record of performance data. This integration enables operators and managers to track trends, analyze performance over different periods, and identify opportunities for improvement, ensuring optimal production efficiency.
Ensuring Accurate Availability Data Collection
Software that can track downtime, like dataPARC, tracks equipment availability through automatic event logging and downtime categorization, providing clear insights into equipment uptime and downtime.
The system uses a reason tree and categorization to assign specific reasons and comments for downtime events, enabling further analysis. This detailed tracking allows users to separate planned maintenance from unplanned downtime, which is essential for accurate OEE calculation.
By categorizing downtime into different levels, dataPARC ensures that all downtime events are accurately recorded and analyzed, helping to identify patterns and implement effective maintenance strategies.
Putting it Together
By using software like dataPARC to collect quality, performance, and availability data, facilities can accurately calculate OEE and implement effective strategies to enhance productivity and reduce losses.
dataPARC’s comprehensive platform integrates all these data points into a single, user-friendly interface, allowing operators and managers to see the entire production picture at a glance. This unified view enables quick identification of inefficiencies, supports data-driven decision-making, and facilitates continuous improvement initiatives. With dataPARC, all critical data is accessible in one place, ensuring that your facility operates at peak efficiency.
FAQ: Calculating OEE in Manufacturing
1. Why is OEE important in manufacturing?
OEE helps identify production losses, uncover inefficiencies, and benchmark equipment performance. It provides actionable insight to improve uptime, throughput, and product quality.
2. What is considered a good OEE score?
A world-class OEE score is typically around 85%. Scores below indicate room for improvement: 60% is average, and 40% or less means there are significant production issues.
3. What are the most common causes of low OEE?
Frequent causes include unplanned downtime, slow cycle times, equipment changeovers, operator errors, and product defects. Breaking OEE into its components helps isolate the root causes.
4. How often should OEE be calculated?
OEE can be calculated daily, shift-wise, or weekly, depending on your operations. Real-time tracking provides the most immediate insight and allows teams to respond quickly to performance issues.
5. What’s the best way to get started with OEE tracking?
Start with a single line or piece of equipment. Ensure you have reliable data sources for runtime, product counts, and quality checks. Use a tool like dataPARC to build an OEE dashboard and review performance regularly with your team.
OEE: The Complete Guide
All the resources you need to successfully implement, analyze, & improve overall equipment effectiveness.