In this article we will explore common types of process engineering software and highlight some powerful software applications that every process engineer should know.

Process Engineers! Solve challenging process & product quality issues with these process data visualization tools.
Types of Process Engineering Software
Process Engineers use software every day for a range of reasons.
There is software that allows users to visualize data, perform calculations, and conduct data analysis to help with process optimization and root case analysis.
Software can help mitigate risk with simulations and modeling. For instance, engineers can test how a process may react to changes without introducing hazards or wasting material.
Today and for the foreseeable future, process engineering software allows us to communicate problems, ideas, and solutions.
Graphical Dashboards
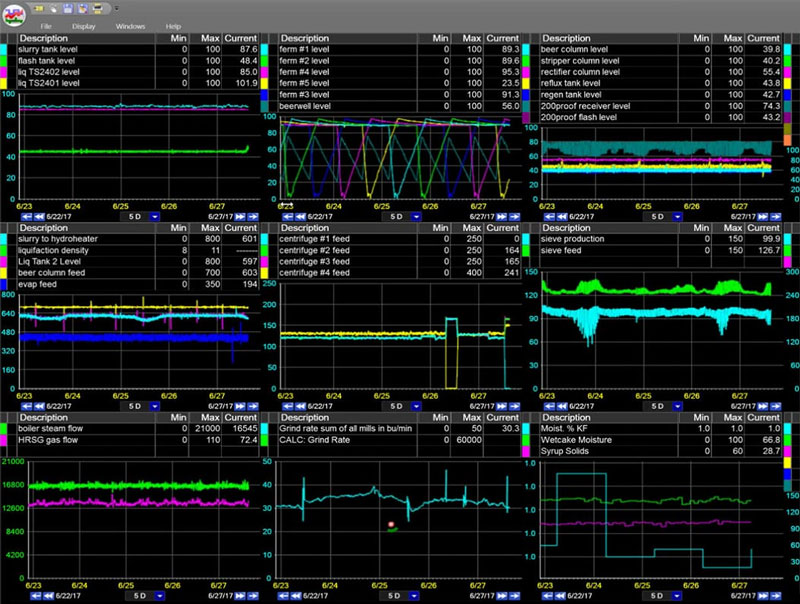
Engineers often create graphics dashboards to help display real-time data in a more consumable way.
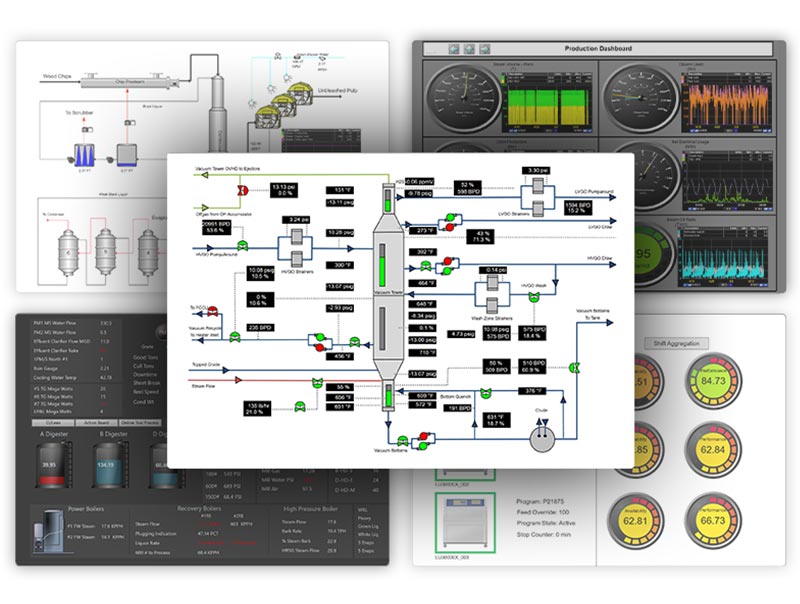
Graphical dashboard tools are often combined with trend visualization software such as PARCView.
When creating a dashboard, it is important to know the audience and information to be conveyed. Will the dashboard be a process diagram, displaying a single view of how the process is running? Or a quality page, showing recent lab data and specifications.
Flashing values or pop ups can be used in displays to alert operations when a parameter goes out of specification. When adding alerts or colors, be aware of colorblindness and how that can modify interpretation of the display.
Reporting Software
Reports can range from detailed documents to concise information with embedded charts and images. The type of report will dictate which software to use.
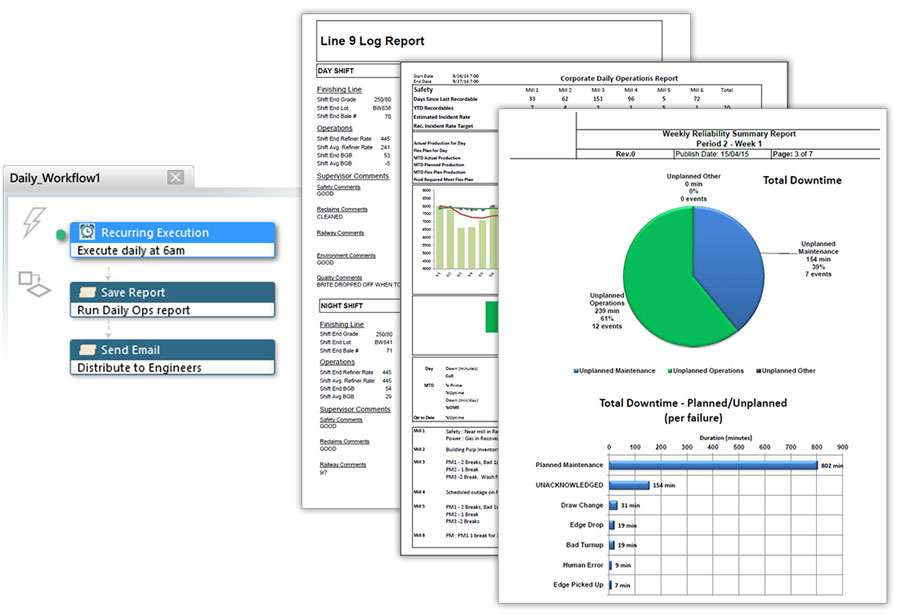
There are multiple reporting tools available. Some, like dataPARC’s production monitoring software use simple coding to pull in data and automate the report while others may require more manual effort.
Microsoft’s Excel is a foundation in data reporting. It is a powerful tool and there are many internet resources that can help users at any level build reports in Excel with VBA.
SSRS (SQL Server Reporting Services) is another standard reporting tool for those who have data in SQL. SSRS can be used to create reports and send them on a schedule.
Microsoft Word is often used to create reports. It is best used for reports where automation and accessibility to data is not needed.
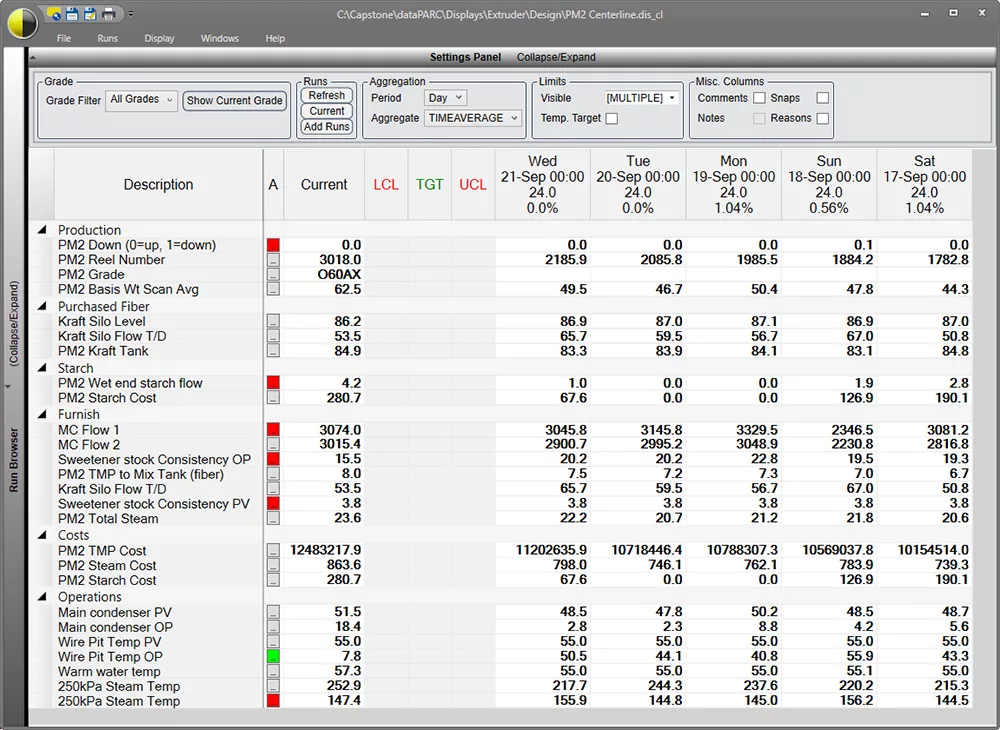
Centerlining Software
Operational envelopes, or Centerlining, is used to make sure process parameters are set up consistently from run to run. This helps to produce good quality product more quickly.
Engineers will build and review operational envelopes as guides. These ranges need to be set up for every product produced, which can be time consuming and inaccurate.
With PARCview’s unique Centerline tool, an engineer does not have to analyze and create the operational ranges. By adding variables to the centerline tool, it can identify if any variables are running outside of normal operational ranges.
LIMS Software
Process engineers can manage and use LIMS (Laboratory Information Management Systems). LIMS provide a way to record, apply limits, and organize lab data and processes.
LIMS can be independent systems such as LabWare or SAP . Others can be integrated with data visualization and process software, allowing users to view lab and operations data and lab data in the same program.
LIMS are important to process engineers because they track testing and quality information which can be key when working with customers or providing a look into plant operations.
ERP Software
ERP software is used for product tracking and scheduling. It can be used to allocate items to projects for billing purposes or for tracking project hours.
ERP software helps keep the process organized and allow engineers and operations to know what is coming up on the production schedule.
SAP and Oracle are two common ERP applications. They help keep everyone on the same page with a single source of truth.
Looking for new process engineering software? check out dataPARC’s process engineering toolkit. Tackle root cause analysis, process monitoring, predictive modeling, & more.
Root Cause Analysis Software
Software to assist in 5 why root cause analysis can help reduce downtime. When a process goes down the cause may not be known right away.
SOLOGIC is a program dedicated to root case analysis, it has tools included cause and effect diagrams, fishbone, and incident timelines.
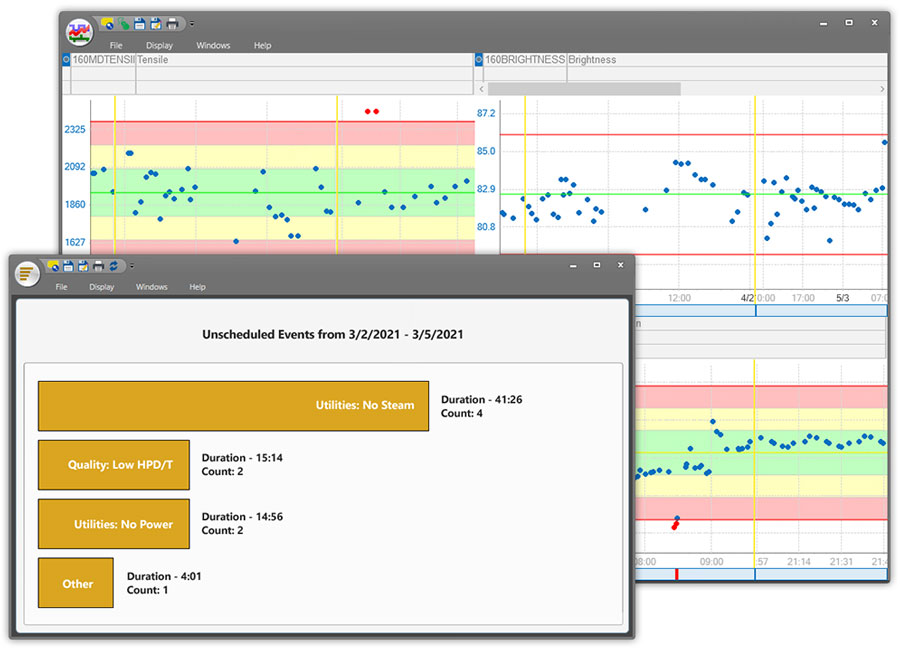
By looking at process trends and centerlines from data visualization software, engineers can identify if any variables were in upset conditions prior to the down.
By recording downtime root causes an engineer could look at that information in a pareto chart. This will identify the most common or most time-consuming reasons for lost time. With this information the engineer can go after minimizing occurrence or duration of a specific cause.
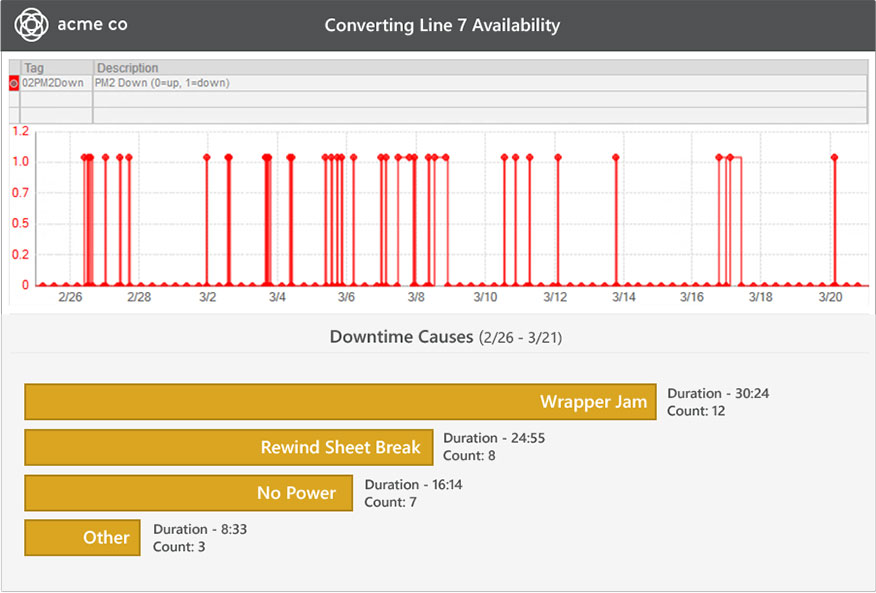
Pareto charts can help identify common lost-time reasons
Data visualization software with built in downtime tracking capabilities can help expedite root cause analysis.
Check out our real-time process analytics tools & see how you can reduce downtime & product loss.
Process Optimization Software
A key role for many process engineers is process optimization. This can include in depth Six Sigma projects requiring large amounts of data, testing and implementation of solutions.
Throughout such projects statistical software, such as Minitab or JMP, is used.
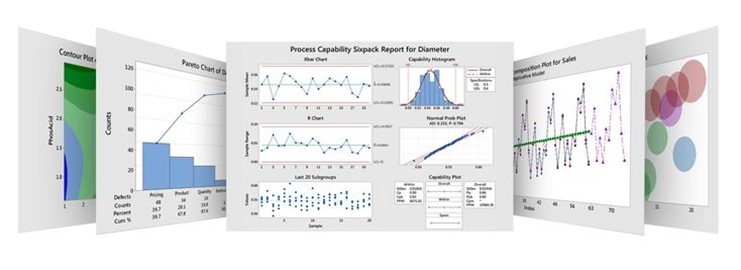
Minitab
Process optimization software can help identify variables that are statistically significant to the process, pointing to the parameters that will have the greatest impact.
Software is utilized to help come to conclusions, however subject matter experts can identify which statistically significant data is also practically significant and worth pursuing.
Quality Management Software
Process engineers work with quality to ensure products are made to the production specification and that customers are receiving a consistent product, order after order.
Histograms of variables with the 3-Sigma value and Cpk can be used to help create or review specification and control limits.
Many data visualization applications can produce histograms and simple charts to help with quality data analysis. Excel can also be used to create such charts.
Process Calculation Software
Process engineers are often responsible for calculating Overall Equipment Effectiveness (OEE), producing process metrics and or other process calculations.
Software will reduce errors in these calculations and produce results quickly.
In the case of process calculations, there are times when making a change to process requires calculating different volumes and ratios of material to prevent a reaction. Utilizing a software over manual calculations can prevent errors that may result in downtime or safety incidents.
Depending on if the value is used for a one-time purpose or needs to be regularly calculated can narrow down which software should be used to create the calculation.
Excel can be used; however, data would need to be pulled into the program. Integrated data visualization software can perform calculations and historize those values, so they are always ready.
Simulation & Modeling Software
Simulation, modeling, and sizing software is used when designing a new process or making changes to and existing process.
AutoPIPE is used for pipe stress analysis, Pipe-Flo can perform fluid flow calculations and AFT Arrow is a gas flow simulation that can be used for insulation sizing. AutoCAD is used for a range of 3-D modeling including drafting and design.
Such model and simulation programs can allow engineers to test and see how the process may perform before it is built – mitigating risk and saving material.
Other Useful Software for Process Engineers
When asked what process engineering software they use daily, each engineer we spoke to had had different programs for the areas of software outlined in the previous section. There were some that came up repeatedly.
Whether you are starting your career as a Process Engineer or have many years under your belt, utilizing some of this software can promote career development and help streamline daily tasks.
Microsoft Office
Microsoft has several programs that are used on a regular basis, even if your company doesn’t have these specific ones, there is something like it.

https://www.microsoft.com/en-us/
Looking for new process engineering software? check out dataPARC’s process engineering toolkit. Tackle root cause analysis, process monitoring, predictive modeling, & more.
Excel
As mentioned in many of the sections above, Excel can be used for a variety of reasons and is a pivotal tool to have in the toolbox. Excel can be used to generate reports, create charts and graphs, complete calculations and analyze data.
Word
Word is a simple tool for creating reports, Standard Operating Procedures (SOPs) and other types of documentation.
OneNote
OneNote is a newer product that can be used as a digital notebook. It helps organize notes, and one could even build their own quick reference guide. Similarly, to other Microsoft products, OneNote notebooks or sheets can be shared with multiple people through OneDrive.
PowerPoint
There are many options for presentation generators and PowerPoint is still used to lead presentations and meetings. PowerPoints are a simple way to present information.
Teams
Teams is not the only online meeting and communication tool, but it is a very common one. Teams is used for inner company chat, virtual meetings, and document sharing. Within teams you can create groups (teams) that is connected to SharePoint to share documents, chat, post. Emails can even be sent directly to a group so other people can comment on it as a thread.
Outlook
Outlook is the primary hub for emails and meeting scheduler. Internally, you can view others calendars to find when free time to schedule a meeting without emailing the back and forth.
Project
Project is used to build Gantt Charts for project management. Often used for scheduled downtime and other large projects. These can be very detailed and helpful to stay organized. There is a bit of a learning curve.
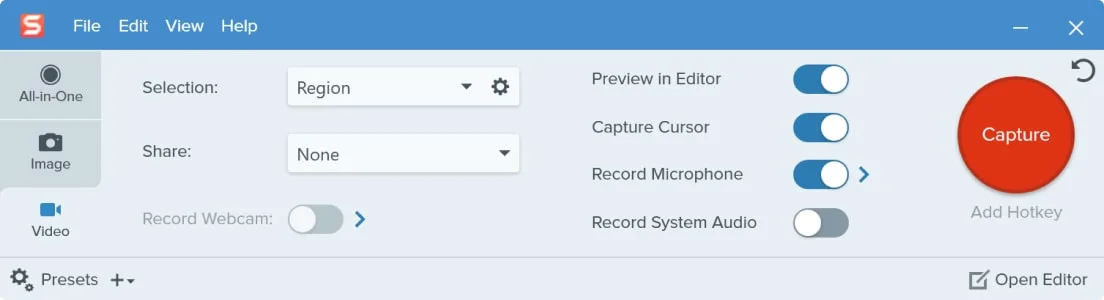
Snagit / Snip It
Screenshots and images are helpful to include in emails, reports, SOPs to enhance communication.
The original screenshot was using the print screen button on the keyboard. Now, with multiple monitors this is unrealistic because the desired image needs to be cropped to a certain size.
Snip it is standard on Windows computer, but it has limited editing options, and does not auto save the images. It does allow to take a screenshot of a certain area, rather than the entire screen.
A step up from Snip it is Snagit, it is a paid software, but it allows multiple screenshots, saving them to a library to come back to later. The editing capabilities are far superior to Snip it, allowing annotation, arrows, blurring, etc.
https://www.techsmith.com/screen-capture.html
These are just a few examples of the countless screen capture software out there. In short, it is an essential tool for all business types.
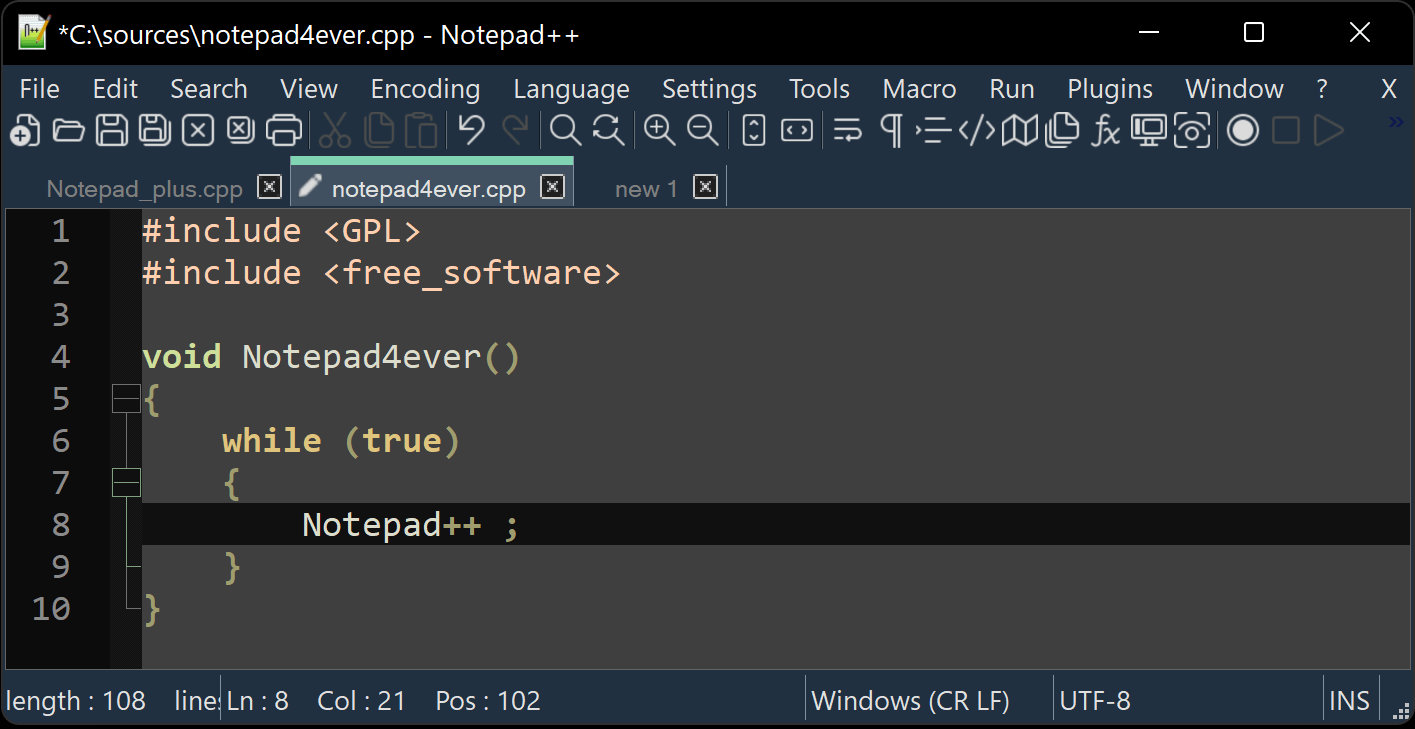
Notepad++
Viewing and editing code without having to run it in production is valuable. Notepad++ is a versatile program allows users to see code in its programing language.
It has add-ins and one can compare code sets against one another, it will highlight what the difference which can help find bugs, typos, etc.
Notepad++ is free. It keeps tabs saved so you can close and re-open without having to save the files to a specific location.
https://notepad-plus-plus.org/
Want to Learn More?
Download our Digital Transformation Roadmap and learn what steps you can take to achieve data-driven success in manufacturing.