Operating and troubleshooting a modern automated manufacturing process requires seeing and acting on hundreds or thousands of individual pieces of data.
Digital control systems and plant-wide information systems have given us the ability to bring all of the data regarding plant status and performance to a single location.
The challenge then is to create effective visual displays that allow the consumers of this information to easily understand and interact with the data.
In the world of digital controls, the visual portion of the human-machine interface, or HMI, is typically a configurable, electronic flat panel display. The challenge is to design graphics for these screens which “best” convey the status of the process to the operators. If you’re interested in learning more about building your own displays, check out our other post about HMI design best practices.
Integrating IT & OT data at your plant? Let our Digital Transformation Roadmap guide your way.
Types Of HMI Screens
For production related processes, HMI screens can be classified into four basic groups:
- Tabular and text based screens – lists or tabular groups of data and status values
- Schematic screens – data are displayed on schematic diagrams of the actual process
- Trend screens – current and historical values of data plotted on graphs versus time
- High performance screens – current data enhanced by basic graphic elements to convey additional information
- Let’s explore these groups in more detail.
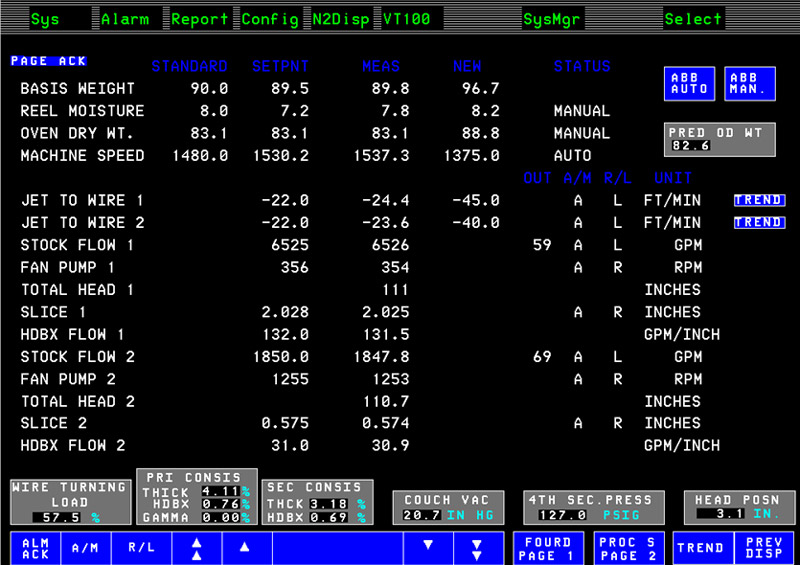
Tabular Data Screens
Tabular data screens are obviously the easiest to design. Having a couple dozen concurrently displayed process values on a single electronic screen is a considerable improvement over previous technologies when the values had to be collected from the field, or observed on a wall of readouts.
This type of display is used in systems where graphic capabilities are limited. They can be effective, especially if there are a limited number of values to display.
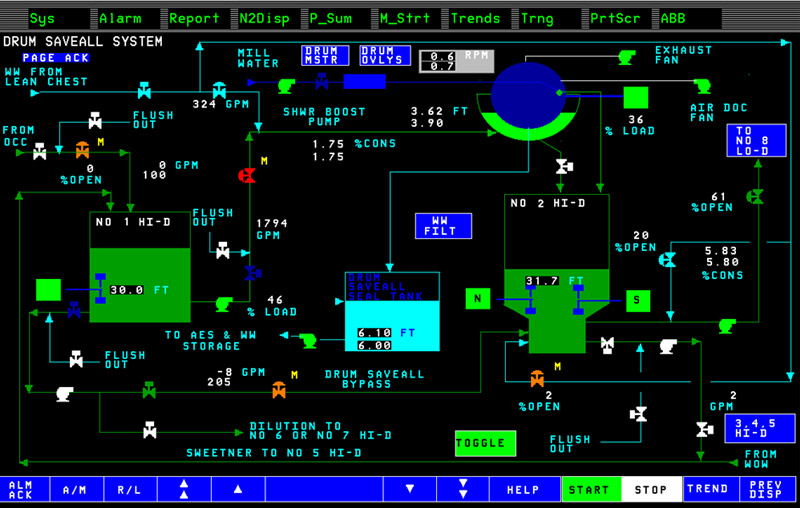
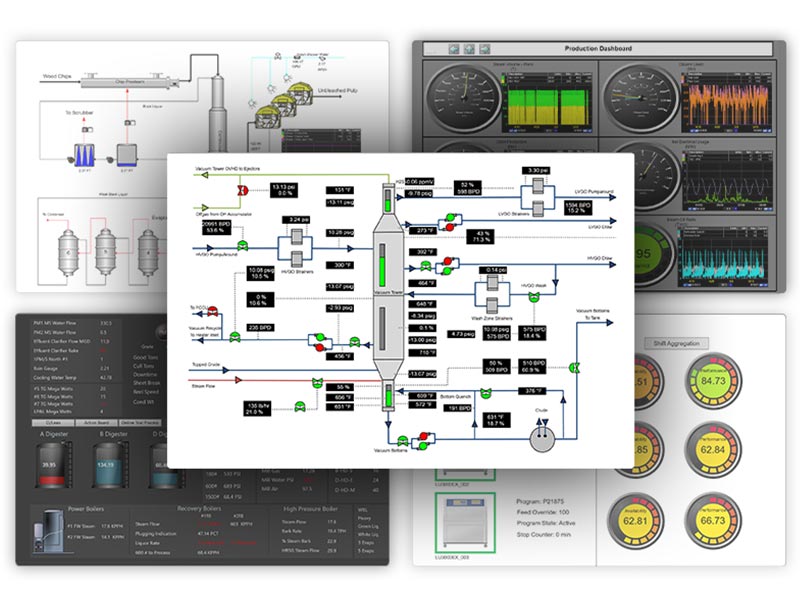
Schematic Screens
Historically speaking, the next class of screens to emerge was schematic representation screens, and this type of screen continues to dominate. Most of the processes controlled by digital control systems are large and complex.
It was an obvious step forward from tabular displays to use the graphic capabilities of digital screens to show a representation, or flow diagram, of the actual process, and to place live values from the field on that diagram.
This type of screen has the advantage of showing the proper process connections at the same time as the process values. This is particularly valuable for newer operators who might not have complete familiarity with the process.
If the screen is an interactive display and some of the values shown represent controllers, the proximity of a controller to a piece of equipment is a visual clue as to its function. Selecting a controller from a schematic process screen reduces the chance that an incorrect controller is selected and changed.
The design of schematic screens must be done carefully. It is easy for a screen designer to overlook certain human factor considerations to create a less that optimum screen. Early graphic screens were limited in their color palettes and font selections. There was also a tendency to pack as much of the process and as many data values as possible onto each screen. The result was screens which were challenging to read and sometimes obscured potentially important information.
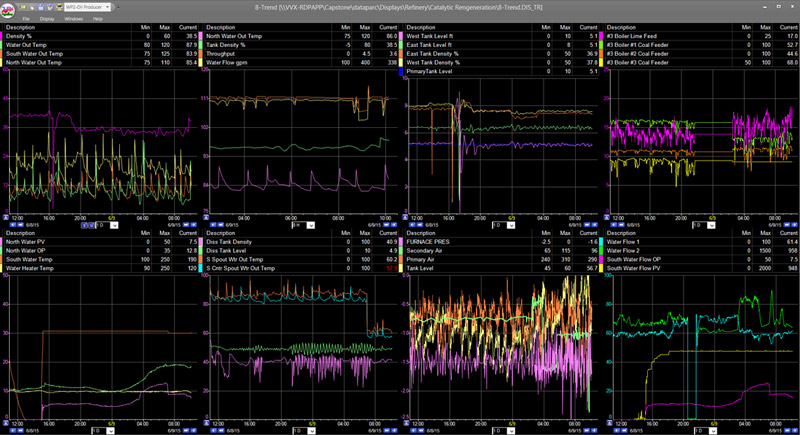
Trend Screens
The next class of screens, and arguably the most useful, is trend screens, or time-based graphs.
Production processes are dynamic. While a schematic screen communicates the location of a given variable within the process, and its current value, it does nothing to communicate how that variable is changing with time. A tank with a 95% level that has been rising for an hour and is about to overflow represents a situation that demands immediate attention. If the inflow to the tank has recently been reduced and the level has started to drop, there is no concern at all.
This kind of information is immediately available by observing a trend of the level over time. Providing trends requires capturing and archiving process data. While DCS providers have always provided some archiving capability, the best data storage and retrieval solutions are available from third party software vendors.
Embracing the idea of trending and putting up many (perhaps dozens of) trends on a single screen provides a powerful tool for quickly determining the overall health and stability of a process. In contrast, to determine the status of a process by looking at an overview schematic screen with 30 or more tags on it, one must look at each tag and mentally compare it to a remembered “normal” value. If the same 30 tags were trended on single screen, a single glance would reveal whether any of the current values were moving away from their recent past values.
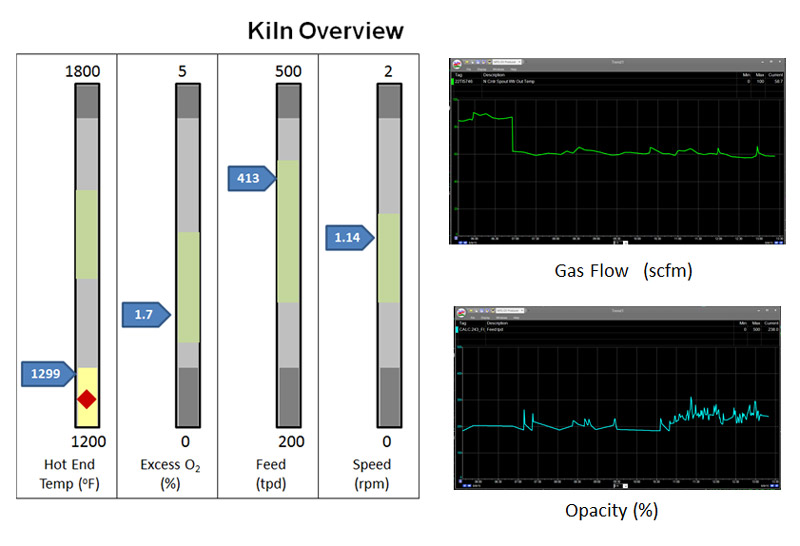
High-performance Screens
The final class of HMI control screens is “high performance” screens. The goal of these screens is to give the operator “situation awareness”.
A high performance screen should not be crowded; it should be graphically simple. Process flows and connections, if they are shown at all, are shown only minimally. Process values are shown “in context”. Not only are numerical values are shown, a visual indication on a scale should show where each value is relative to the tag’s minimum and maximum. The scale would also visually show a normal operating range, and if appropriate, alarm limits.
Build Real-Time Dashboards & Displays for Effective Process Monitoring with dataPARC
Due to their efficacy of communicating past and present states, critical trends are sometimes included in high performance screens. The end effect of a high performance screen is to quickly communicate to an operator the status of a process, and if there is problem, to be able to quickly identify and correct it.
With the emphasis on simplicity and clarity, the number of high performance screens may be greater than the number of traditional screens needed to show a given process. In this case, the most important tags are displayed in an overview screen, and supporting information for different parts of the process are available by “drilling down”, or bringing up screens which show greater detail regarding each portion of the process. Maintaining a multi-level hierarchy keeps all of the screens relatively clean and easy to understand, but allows fast access to the required information.
Choosing “The Best” HMI
As with choosing the “best” automobile, there are differing opinions as to what constitutes the best style of HMI screen. While there are visual design guidelines that should be followed for all display types, each style has its strengths and individuals may have a preference for one over another.
High performance screens offer simplicity and the ability to quickly determine abnormal situations, but rely on an operator’s firm knowledge of the process flows and connectivity. Some experienced operators prefer the economy of motion offered by having fewer, more densely populated screens. With a solid knowledge of which values are important and what they should be, having fewer screens to navigate makes monitoring the entire process easier for them. A less experienced person might prefer detailed schematic screens.
When trying to troubleshoot a problem, particularly in an unfamiliar area of the process, it is essential to have an accurate depiction of the process connections. While trends are essential and unique in their ability to relate time based value movement, they also require a firm mental image of the process layout and flows.
Fortunately, as the price of large display screens has come down, many facilities have been able to get away from the “this or that” decision. Ideally, multiple monitors at a workstation allow an operator to have the best of all worlds. One monitor can have a high performance “dashboard” of the most important variables, while other monitors simultaneously display schematic and trending screens.
A setup like this provides both experienced and novice operators the ability to determine the status of a process at a glance, and if needed, the ability to determine the source of any problems and react appropriately.