Consistent product quality is important because customers want to know what they can expect from the products they purchase. One way to ensure consistency is to inspect every product after it is made and either reject or accept it.
However, in many cases, 100% product inspection is not efficient due to the variety, complexity, or volume of products being produced. A better way to ensure consistency is to make sure that the manufacturing process runs the same way all of the time. This is where centerlining can help.
What Are Centerlines (Operation Envelopes)?
Centerlining, known as Operation Envelopes in some industries, is a philosophy or methodology that utilizes established process settings to ensure a consistent manufacturing process. These process settings often consist of ranges, with upper and lower limits, to allow for flexibility to deal with outside influences (for example, to account for the changes that occur as certain components age or wear). While the original purpose may have been to ensure consistent product quality, several other purposes have evolved, including operating equipment within design limits or safety limits, ensuring adequate cooling or lubrication, and many others. In this blog we’ll use the term Centerline, but whether this term is well known to you, if you call them Operation Envelopes or something else, the concepts and information applies.
Centerlining In Four Steps
To “centerline” a process, you must perform these four steps:
- Identify the important process factors or “variables”
- Determine the best settings and ranges for all of the important variables – by grade or product if multiple products are being produced
- Determine how these variables affect the process and the product
- Ensure that the centerlined settings are always used during production
Continuous Improvement
Centerlining is a never-ending process, and continuous work on all of these steps is needed in order to reap the most benefits. Benefits can include one or more of the following: improved product quality, increased production, reduced downtime, reduced off-quality product, reduced waste, reduced costs, and/or increased profits. Centerlining can also help in the detection of process upsets, which allows corrective or preventative actions to be taken.
Part of the Process
It must be stressed that centerlining alone cannot achieve all of the potential benefits. The best results can only be achieved if the equipment is properly maintained and upstream processes are also centerlined. Additionally, easy access to process data and trends from past runs can enhance centerlining efforts by making it easy to determine where the process is, where it’s supposed to be, and where it has been historically.
On the road to digital transformation? Get our Free Digital Transformation Roadmap, a step-by-step guide to achieving data-driven excellence in manufacturing.
Centerlining A Familiar Process
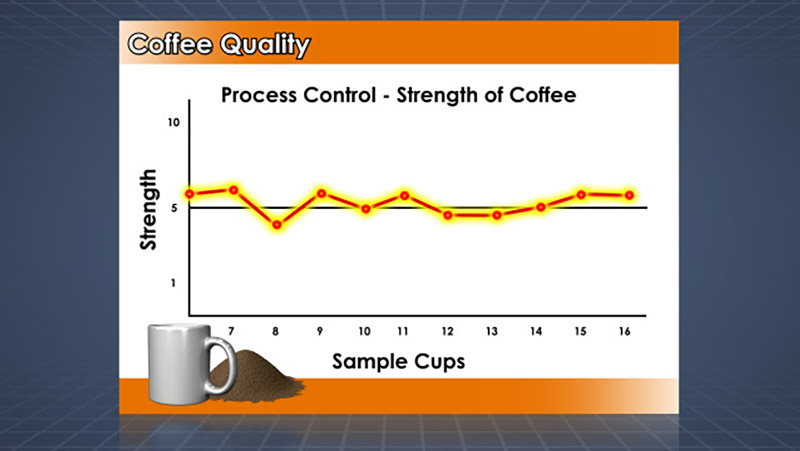
In order to better understand the concept of centerlining, we will describe how the familiar process of making coffee can be centerlined.
Variables
Let’s say your goal is to make a great-tasting pot of coffee that tastes the same every time. The first thing you need to do is compile a list of the main variables that affect the coffee’s taste. This might include:
- The brand and type of coffee
- The amount of coffee added to the coffee machine
- The amount of water added to the coffee machine
There are other less-obvious variables, like the cleanliness of the coffee pot, the temperature of the water supplied to the machine, the model and brand of the coffee machine, and possible malfunctions in the coffee machine. As you can see, there are many variables that can affect even a simple process like making coffee.
Effect on Process
Once the list of important process variables has been created, the effect of each variable on the product must be determined. To do this, you might try making coffee using different brands and different amounts of coffee (keeping the amount of water added constant), and hold taste tests to see which variable settings result in the best-tasting cup of coffee.
Acceptable Range
Note that even in a simple process like making coffee, some of the variables interact with each other. For example, brand A might produce its best tasting coffee when made with 1 tablespoon per cup, and brand B might produce its best tasting coffee at 1 ½ tablespoons per cup, but this might not be detected if you don’t taste all combinations of all of the variables. Therefore, it is a good idea to use some sort of statistical method to set up the testing procedures and analyze the results. This will help ensure that you centerline the best combination of process settings, and can also reduce the amount of testing that is necessary to determine the best process settings.
Create the Recipe
After you have identified the process settings that produce a great-tasting cup of coffee, you need to create a detailed “recipe.” This recipe would list all of the procedures and measurements that you used to make the best tasting coffee. The use of this recipe every time would produce a consistent tasting cup of coffee. It should also allow anyone else, not just you, to follow the recipe and make the same great-tasting coffee.
Note that if a significant variable were to change – for example, if you had to switch to a new brand of coffee or if your water source changed – the centerlining process would need to be revisited. Also, if multiple “grades” of coffee were being made – dark roast, regular, and decaf, for example – different centerlines would need to be established for each.

Centerlining A Manufacturing Process
Just as a detailed recipe is required to make a consistent cup of coffee, an industrial process like papermaking or oil refining requires a detailed “recipe” to produce a consistent, high quality product – in these cases, a sheet of paper or a gallon of gasoline. Centerlining ensures that the best settings and procedures are in place during production to ensure that the process runs consistently and it produces a consistent, high quality product. If multiple grades or products are being produced, easy access to grade-specific or product-specific centerline settings and ranges is critical.
For instance, in the pulp and paper industry, some commonly centerlined papermaking variables include:
- Percentages of different types of pulp fibers in the papermaking furnish
- Amount of pulp refining
- Chemical additive addition rates
- Press nip loadings (pli) in the press section
- Machine speed and draws
No matter what you’re producing, the centerlining process is fundamentally the same. Follow these steps to implement centerlining at your facility:
Identify key variables
The key variables in your manufacturing process can be determined by operators and agreed upon by the stakeholders at your facility. It’s extremely important to select the correct key variables if you truly expect to have a positive effect on the process and product quality. For this reason, oftentimes a consultant or other industry expert will be brought in to evaluate your process and identify the variables you will centerline.
Create variable limits
Your next step will be to create limits for these key variables. Here you’re basically determining the acceptable range for each variable. Anything falling outside of the acceptable range will result in unacceptable product quality. Referring to our paper manufacturing example above, you might determine that your main product grade requires 10% to 20% long fiber in the furnish.
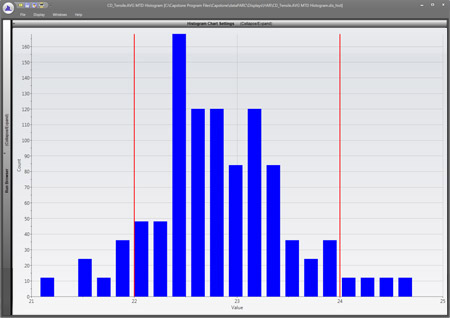
Establishing variable limits is a key part of centerlining.
Variable limits can be established a number of ways. Often this is managed in a series of spreadsheets or tattered printouts stored in a file cabinet. A better way is to use a process information management systems (PIMS), like dataPARC’s PARCview solution. These tools facilitate centerlining by allowing users to enter target values and operating ranges or limits for process tags. The best of these products allow different limits to be specified for different grades, products, or SKUs. As mentioned above, you may not use the same volume of ground coffee when making a dark roast as you would with a light roast.
Another key feature is the automated calculation of limits. Computerized solutions can efficiently calculate the average, standard deviation and 3-sigma limits for any variable. These calculators can also account for multiple grades, products and SKU’s; calculating different limits for these different operating conditions.
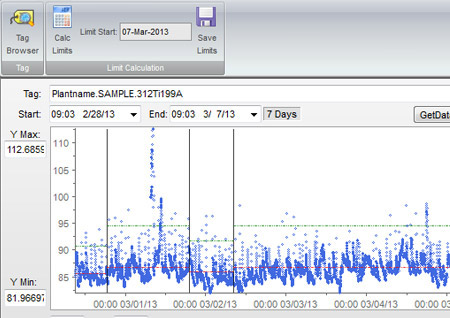
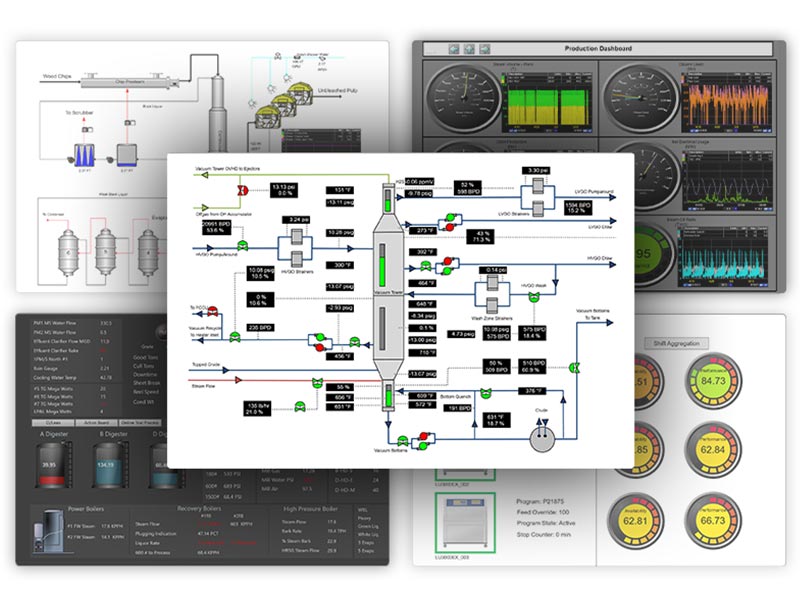
dataPARC’s PARCview solution can calculate limits for multiple variables automatically.
Evaluate Effect Of Variables
Once your key variables and variable limits have been established, you’ll need to monitor those variables to evaluate your newly centerlined process. This is where access to accurate, clearly presented data is tremendously important. It’s certainly possible to evaluate a centerlined process using manual methods of data recording, but it takes considerable time to record and recall that data and the possibility of data error is quite high.
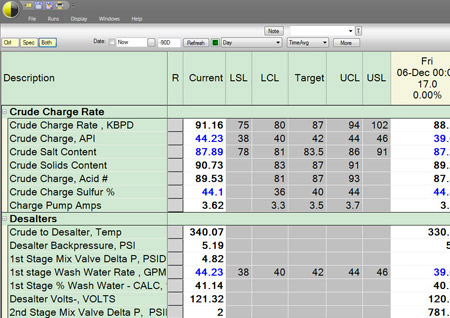
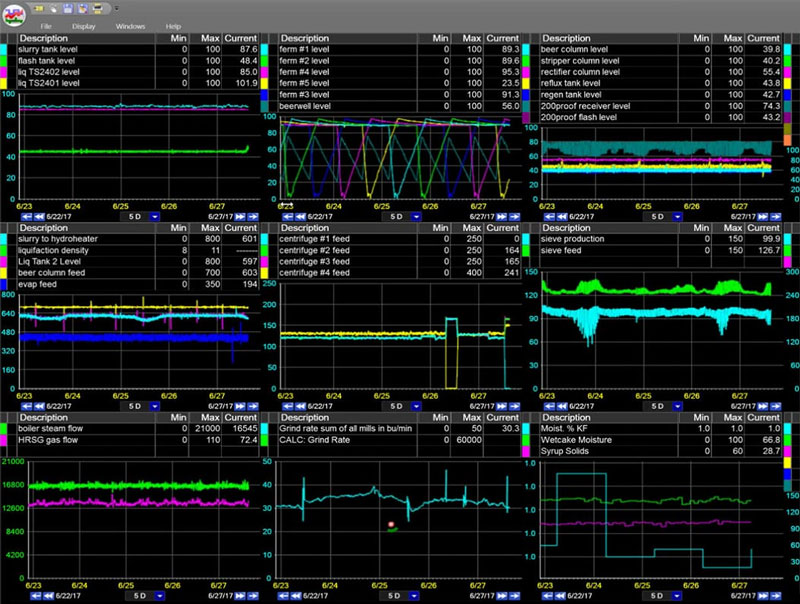
Accurate, neatly-organized data is key to displaying effective centerlining efforts.
It’s much easier to employ some type of software — either a dedicated centerlining application or a combination of data historian and data visualization tools — to configure a solution that will allow you to access accurate visual data as it pertains to your centerlined process. These applications allow you to build precise visual displays that show you how your process is performing related to centerline. When evaluating these solutions, be sure to consider their ability to present data in the following resolutions, as together they provide the most complete data for assessing your centerlining efforts:
- Real-time – Understand right now how the process is performing vs. its Centerline and identify where adjustments may be needed
- Longer term analysis – Daily or weekly review of which products are performing best vs. Centerline and the areas of improvement
- Limit review – Monthly or quarterly review of Centerline limits to ensure the process hasn’t changed. In theory, as the process improves, the centerline limits should get narrower.
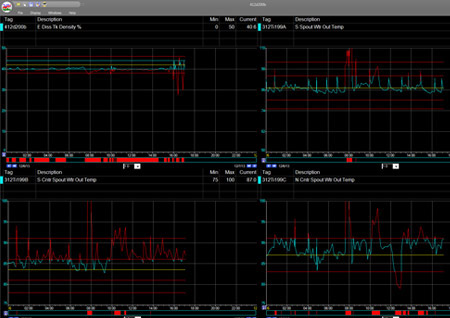
Accurate, neatly-organized data is key to effective centerlining efforts.
Ensure centerlined settings are used during production
Now that you’ve figured out your optimal process, here’s where you build your recipe. Instruct operators and engineers about your new processes and make resources available to them that allow them to easily understand any changes you’ve implemented. At this stage you’ll want to make sure you have solid reporting on a hourly, weekly, or daily basis to evaluate product quality against centerlines. Many software-based solutions contain reporting modules that allow you to easily review this data and send it off to key stakeholders.
Conclusion: How To Centerline A Process
So, we’ve given an overview of how to centerline a process and how centerlining can be applied to both common and more complex manufacturing processes. Hopefully we’ve given you some ideas about how you might perform centerlining at your own facility to improve your processes and deliver a more consistent product.
OEE: The Complete Guide
All the resources you need to successfully implement, analyze, & improve overall equipment effectiveness.
