In this blog post, we’ll dive into what Maximum Sustainable Rate (MSR) analysis is, why it’s important, and how it can help find and eliminate bottlenecks in manufacturing.
In manufacturing, it’s not uncommon for production departments to face pressure to increase production year after year. They scramble to come up with ways to meet this demand. Often resulting in disjointed efforts and inconsistent results between departments.
This is where Maximum Sustainable Rate analysis comes in. MSR, also known as Maximum Sustainable Capacity (MSC) provides a framework for data-driven, consistent estimates of process capability. Which creates a standard way of looking at processes and ensuring everyone is on the same page.
Monitor, report, & analyze production data with dataPARC for fast MSR analysis.
Utilizing Maximum Sustainable Rate
Year after year, manufacturers try to increase and optimize their plants’ capacity. To do this, looking across the entire operation to identify bottlenecks and current production is important.
By understanding each unit’s maximum sustainable rate (MSR) in a process, manufacturers can better assess the total impact of desired production changes and identify potential bottlenecks in the system.
It is a data-driven approach. Without MSR, three people could be asked about process bottlenecks and capacity and have three different answers. This enables manufacturers to answer important questions; “What is the next bottleneck?”. Then they can make informed decisions about where to invest resources.
Another key use case of MSR is assessing the impact of changes in raw material sources. For example, suppose a paper manufacturer is considering using an alternative raw material source such as OCC or Kraft. In that case, MSR can be used to determine whether the current production system has the capacity to handle the change.
This analysis may reveal that running the equipment harder is necessary to maintain the desired production rate. Therefore, increased preventative maintenance or additional equipment is needed to handle the new raw material.
By understanding the impact of raw material changes on production capacity, manufacturers can make informed decisions that optimize both production efficiency and product quality.
MSR is a framework that helps manufacturers determine the optimal production rate that can be sustained without increasing downtime, wearing down the machine, or compromising quality, safety, or environmental standards.
Maximum Sustainable Rate Charts
Part of the MSR framework is generating and reading MSR charts. These charts should be created for each unit in the process.
How to Prepare
To utilize MSR charts effectively, some information needs to be gathered beforehand.
Production Data – The site needs to collect production rate data on each unit during the analysis process. Ideally, there would be about a year of production data to capture seasonal changes or raw material changes to use when creating the MSR chart.
Subject-Matter Experts – A Six Sigma lead or outside resource can help conduct the MSR, ask the right questions, and facilitate the conversation, but subject-matter experts (SMEs) must be involved. So, when it comes time to answer questions about what can be done to move the needle, someone who fully understands the unit/process is invaluable.
Slowdown & Downtime Reasons – Recording slowdown and downtime reasons on a per-unit basis will help identify the causes of slowdowns. Pareto charts can then be used to group these reasons into categories. This makes it easier to identify what the most beneficial issue to go after could be.
Other Tools – Other tools could be necessary to help track and identify slowdown/downtime reasons. After changes are made, it is important to track the progress and ensure the sustainability of the changes.
Create MSR Charts
Collect, Normalize, and Sort the Data – MSR charts show production data sorted from the highest production rate to the lowest. To do this, the data must be collected and normalized to the same production rate.
In a later step, the production rate of each unit will be compared in a bar graph. By normalizing the rates, the different units can be compared side by side to see which ones are truly limiting overall production.
Determine MSR – After the data is plotted, determine the unit’s MSR. It is not realistic to pick the highest production rate. A starting point is 90% from the highest production, a subject-matter expert may have a different opinion.
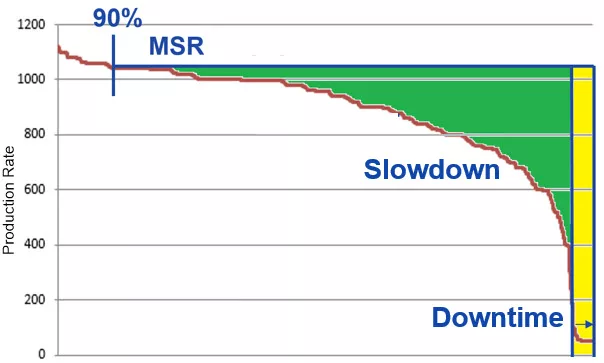
This is a sample MSR Chart. The production rate is sorted from highest to lowest. MSR is set at 90%, and anything less than that is considered a slowdown and can be seen in Green. The Yellow indicates the downtime.
Calculate the Average – Once you have all the data, calculate the units’ average production rate.
Calculate Utilization – To calculate the units’ utilization, take the average production rate and divide it by the MSR production rate. This will be used in the next step. The utilization tells how much room (realistically) there is to improve.
(Average Production Rate/ MSR Production Rate) *100 = Utilization %
Repeat for Each Process Unit – For each unit, repeat the steps above. Also create MSR charts of different production years, these charts may be helpful in later analysis. It is important to calculate each process unit as it will help trigger questions in the next step of the process.
Maximum Sustainable Rate Analysis and Solutions
Now that the charts have been created and the utilization calculated, it is time to analyze and break down the data.
Since the data is normalized, it can be compared side by side. Place the MSRs and utilization percentages into a bar chart for the entire process. From here, it is quick to identify which unit(s) rates are limiting production; either due to low utilization or low MSR.
The next questions to ask are: what is causing low utilization, and can the MSR be moved up?
Low Utilization
Low utilization can be categorized into either slowdowns or shutdowns. A Pareto chart can be a helpful tool to organize slowdown and downtime reasons to identify what problems are fixable within the scope.
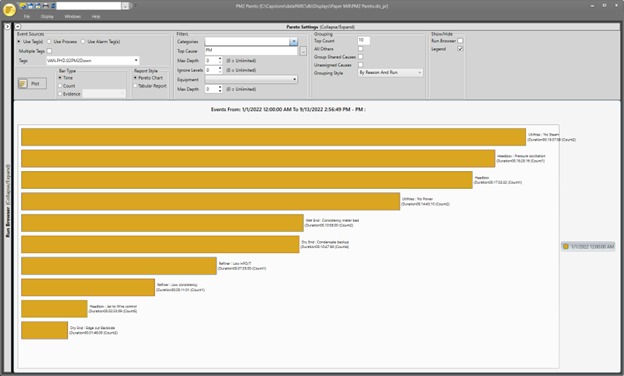
The Pareto chart above shows downtime events grouped by pre-defined reasons.
Slowdowns can occur for a few reasons. If a low inventory is causing the unit to slow down, this points to further investigation on upstream units. Alternatively, if inventory is too high and there is nowhere for it to go, take a closer look at the downstream process.
Utilities such as steam or electricity limitations can be another reason for slowdowns and not one that can be resolved within the scope of an MSR. Process-related issues can also cause slowdowns. These process problems are where we want to focus on finding resolutions.
Shutdowns are commonly separated into two groups, planned and unplanned. Planned downtime is necessary for maintenance and safety. Unplanned downtime, specifically unplanned downtime on the unit that is being analyzed, is where one should focus on potential solutions.
Low MSR
If there is a unit or two within the process that has a low MSR production rate, the goal may be to increase it. Comparing MSR charts year over year for the same unit can help identify a new MSR. In addition, speak with an SME to help pinpoint this value.
Increasing the MSR of one unit could increase inventory to those downstream, improving other units’ utilization. However, focusing all the effort or money on one may not bring up the other ones. Improving one unit doesn’t mean the others will follow. Look at all process units in the system and ask, “What’s the next bottleneck?”.
Identifying Solutions
Solutions to help close the utilization gap or increase MSR are not one size fits all. Therefore, solutions will need to be identified based on the reasons for slowdown and downtime found to be related to process problems.
A robust downtime tracking solution with reasons and sub-reasons will help make identifying issues easier and get to the root cause faster. For other suggestions, read 5 effective ways to reduce downtime in manufacturing.
Keep in mind that increasing a unit’s MSR could be a capital investment. A cost analysis may need to be done to determine if it is the right choice.
Monitor, report, & analyze production loss from unplanned downtime, poor quality, and performance issues.
Monitoring Solutions
Once improvements have been put in place, system monitoring can be used to ensure the improvements are maintained. The best tool is a multi-trend, it can include tags from different units and include limits.
dataPARC’s Centerline tool displays past runs with the current to see if the unit is running consistently quickly. A combination of alarms, manufacturing KPI dashboards and reports can also be utilized to monitor the process and bring attention to any issues.
Data Challenges
A common challenge with performing an MSR analysis is the data. This method requires a year’s worth of data (or more) across multiple units. The data could be difficult to access or slow to pull depending on the site. Here are some tips for working with large data sets.
Find the right tags – Identifying the tags for each process unit before pulling the data will save time. Sites can have thousands of data tags and pull in an SME to help identify the correct ones.
Aggregate – Data can be stored in various ways, but pulling sub-second, second, or even minute data for an entire year could take some time. Having the data aggregated beforehand can save time and see if your historian has the option to aggregate data.
Build MSR Charts Quickly – While creating MSR charts manually is possible, tools like PARCview make the process faster and simpler. Using software to build the charts will calculate for you and make things like MSR charts for multiple years easy to do on the fly.
Final Thoughts
Maximum Sustainable Rate is an essential tool for manufacturers to optimize their production capacity. The MSR analysis provides a framework for data-driven results, creating a standard way of looking at processes and ensuring everyone is on the same page.
By understanding the MSR of each unit in a process, manufacturers can better unit(s) rates limiting production and find resolutions to process-related issues.
OEE: The Complete Guide
All the resources you need to successfully implement, analyze, & improve overall equipment effectiveness.