If you’ve ever tried to get live process data onto a screen for your operators, you know the problem isn’t the data, it’s getting the right tool to connect it, display it, and keep it current without a six-month IT project. In this blog, we break down the tools manufacturers are actually using today to build simple, live manufacturing floor dashboards, how they compare, and how to choose the right one for your plant.
Build Real-Time Dashboards & Displays for Effective KPI Monitoring with dataPARC
We are living in the age of data. We have all these sensors, PLCs logging, and SCADA systems capturing every tag. However, manufacturers continue to run into the issue of data visibility and getting the right data in front of the right people to help make those important decisions.
With data spread out, we see familiar patterns across industries. Someone pulls a shift report after the fact, a quality issue gets caught too late, or a machine sits idle while a supervisor waits for confirmation of what went wrong.
The data existed. It just wasn’t in front of anyone.
That’s what real-time plant floor dashboards solve. This has become more widely adopted in the past few years, but some sites are still catching up. If that sounds like you, this article will cover some tools manufacturers can use to see real-time data on the floor. These tools are user-friendly and don’t require dedicated IT resources to build each display; it can be as simple as clip and drag.
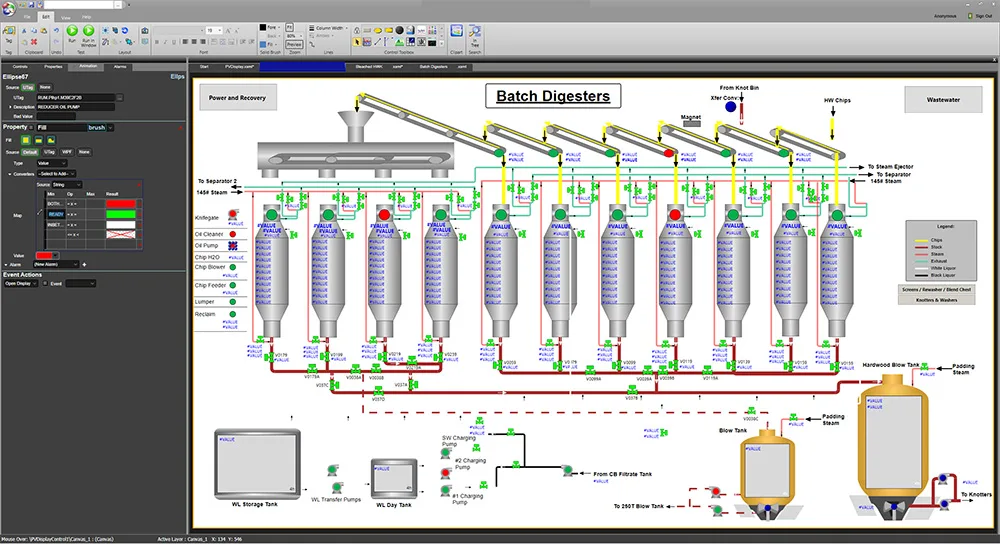
The dataPARC Graphics Designer allows users to drag and drop tags onto the canvas or elements to animate them with the tag information.
What Features Are Good for Creating Live Dashboards?
Not every dashboard tool is built for the real-time visualization that is needed on a manufacturing floor. A tool that works well for a sales team or a finance department often falls short in a manufacturing environment. Data moves fast, screens get glanced at from across a room, and the people using them may not be sitting at a desk.
A manufacturing dashboard tool generally needs to do these things well:
Connect to your data sources. Whether your data lives in a historian, a PLC, a SCADA system, or an MES, the tool needs to reach it.
Update in real time. A dashboard showing data from two hours ago isn’t a dashboard, it’s a report. Live visibility means data updates in seconds, not after each shift.
Be simple enough for non-developers to configure. Engineers and process owners should be able to build and modify displays without writing code or filing an IT ticket.
Display clearly at a distance. Shop floor screens are often mounted on walls or above equipment. Having control over font and display sizing is important.
These criteria are the lens for evaluating the tools in the next section.
The Tools People Are Using Today
The right tool depends on your data sources, your team’s technical skills, and how quickly you need to get something on a screen. But these are the tools that come up most consistently when manufacturers talk about building live plant dashboards.
PARCview by dataPARC
PARCview is purpose-built for process manufacturing environments where the data lives in a historian. Unlike general BI tools, it connects natively to industrial historians, including OSIsoft PI, IP.21, Honeywell, GE, and Aveva, as well as MES, ERP, lab, and quality systems, pulling everything into a single view.
Data integration and access are key pain points for operations on the plant floor. With PARCview, all this data comes together in one system, allowing users to view and analyze the data together regardless of where it is saved.
Dashboards update in real time, displays are configurable without developer support, and the tool includes pre-built graphic objects designed for plant floor environments. For teams that want live visibility without a heavy IT lift, it’s one of the most direct paths to a working shop floor dashboard.
Grafana
Grafana is an open-source visualization platform that’s gained significant traction in manufacturing, particularly among teams working with IoT sensor data. It connects to a wide range of data sources and produces clean, real-time dashboards.
The tradeoff is that it’s a developer tool at heart. Setting it up and maintaining it requires technical skill, and it has little to no out-of-the-box manufacturing context.
Microsoft Power BI
Power BI is the go-to choice for manufacturers who already live in the Microsoft ecosystem. Simply because they already have it. It’s flexible and widely understood.
The key limitation for creating a floor dashboard is that it’s fundamentally a business intelligence tool. This means refresh cycles can lag, and it’s better suited for shift reviews and management reporting than true live floor monitoring.
Why Manufacturers Are Turning to Purpose-Built Tools Like PARCview
General-purpose BI tools like Power BI and Grafana are powerful, but they weren’t designed with the plant floor in mind. Getting them to work in a manufacturing environment typically means custom connectors, developer time, and ongoing maintenance every time something changes upstream. For many operations teams, that’s a barrier that keeps dashboards from ever getting built, or keeps them perpetually out of date.
The difference with purpose-built tools is that the hard parts are already solved.
In a process manufacturing environment, most of the data that matters, temperatures, flows, pressures, quality measurements, batch records, already live in a historian. A tool like PARCview is designed to connect to that historian. From there, operators and engineers can build and modify displays themselves, without filing an IT ticket or waiting for a developer.
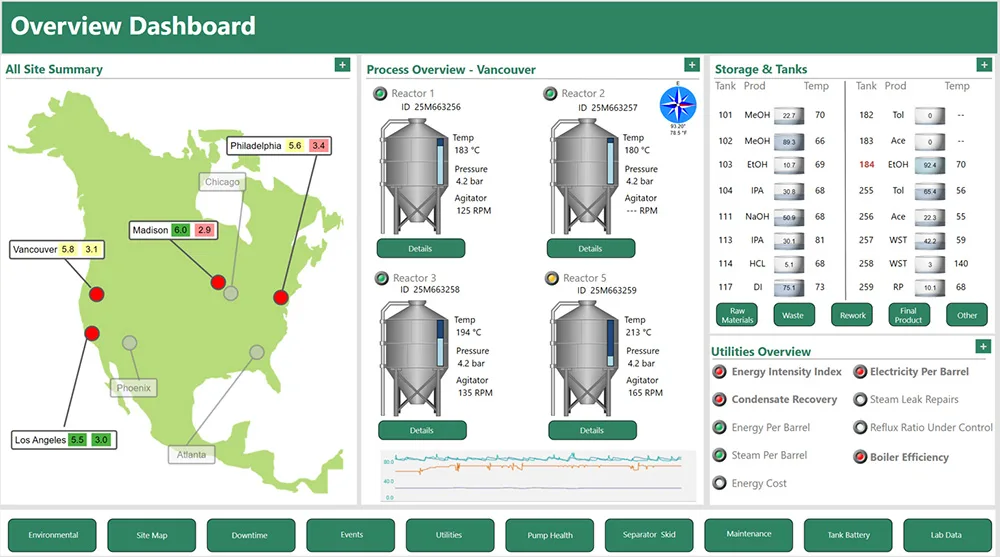
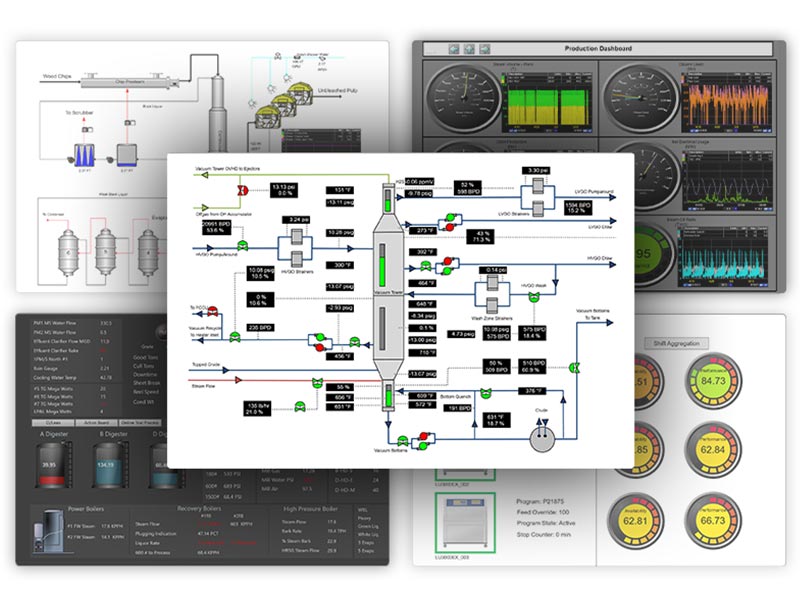
This is a simple PARCview dashboard showing the overview of a process. Buttons link to other displays making for easy navigation. Tank levels are depicted both numerically and visually to quickly identify where the level is.
That matters because manufacturing dashboards aren’t a one-time project. Processes change, equipment gets added, KPIs shift. A dashboard that requires developer involvement to update will quietly fall behind reality. A tool that puts configuration in the hands of the people closest to the process stays current.
There’s also the question of context. A general BI tool will show you a number. A purpose-built industrial tool shows you that number against its operating limit, its historical baseline, and its relationship to the process conditions around it, all in real time, in a format that makes sense to an operator standing ten feet away from a screen.
That’s the practical difference between visualizing data and actually running a plant with it.
How to Get Started with a Manufacturing Visualization Tool
When evaluating tools for manufacturing live dashboards, ask these practical questions:
- Where does my data already live: historian, PLC, MES, or somewhere else? Can this system connect to it?
- Who will build and maintain this: an engineer, an IT team, or an operator? Is the tool user-friendly enough that anyone can build and maintain it?
- What can the refresh rate be, live to the second, or is a five-minute refresh?
- Will this be able to scale to other lines, sites, or systems later?
If your data lives in a historian and you need real-time visibility without a major IT project, PARCview is worth a close look. It’s designed specifically for that scenario, connecting directly to your existing historian, putting dashboard configuration in the hands of your engineering team, and getting displays on the floor without months of custom development work.
The goal isn’t a perfect dashboard. It’s a useful one, built quickly enough that your team actually uses it.
Interested in learning more about PARCview Displays? Request a Demo
FAQ – Manufacturing Dashboards
- What is the easiest tool to use for building a manufacturing floor dashboard? The easiest tool for building manufacturing floor dashboards is PARCview. PARCview is one of the fastest paths to a working dashboard, it connects natively to your data without custom integration, and engineers can build and modify displays without developer support. For teams starting from scratch with no historian, dataPARC also has a Historian.
- Can I build a live plant floor dashboard without IT involvement? Yes, with the right tool a live dashboard can be built without IT help. Purpose-built industrial visualization tools like PARCview are designed to be configured by engineers and process owners directly. General BI tools like Power BI or Grafana typically require more IT involvement to set up and maintain.
- What’s the difference between a floor dashboard and a SCADA system? SCADA systems are primarily designed for real-time control and monitoring of equipment, with limited data retention, typically hours or days. A floor dashboard is focused on visibility and decision-making, often pulling from a historian to show both live and historical context side by side. Many plants use both together.
- How is PARCview different from Power BI for manufacturing dashboards? Power BI is a general business intelligence tool that works well for reporting and trend analysis but wasn’t built for the plant floor. It can struggle with true real-time updates and doesn’t connect natively to industrial historians. PARCview is purpose-built for process manufacturing, it connects directly to historians like OSIsoft PI, IP.21, and others, updates in real time, and is designed to be used by operators and engineers, not data analysts.
Mastering Manufacturing Metrics
The Ultimate Guide to Establishing, Measuring, & Reporting KPIs for Peak Plant Performance