Manufacturing Process Optimization Software
Drive Continuous Process Optimization
dataPARC’s process optimization tools help you to improve, optimize, and stabilize manufacturing processes. Analyze, adjust, and control processes to drive improvements in quality and overall process efficiency.
Define, Measure, & Analyze
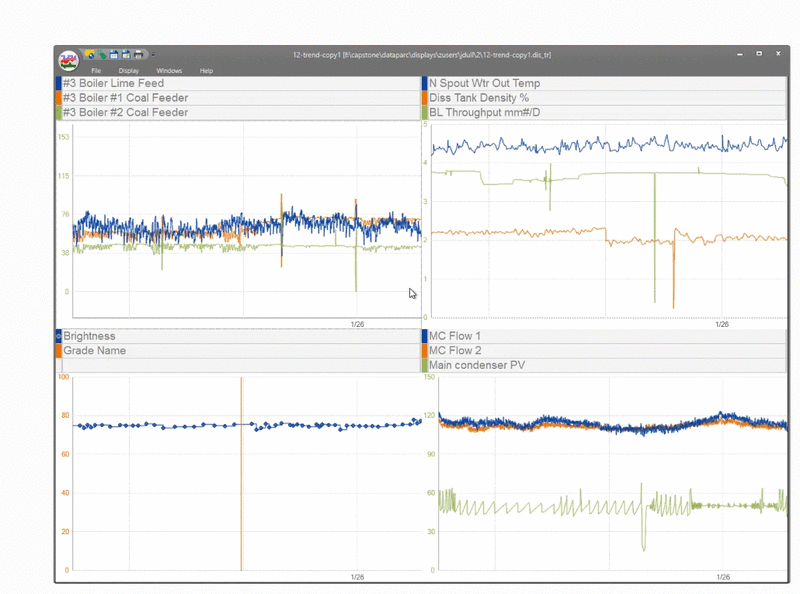
Connect, collect, and combine data from any source at the plant. Use dataPARC’s industry-leading data visualization tools to quickly analyze large sets of production data and identify opportunities to improve process efficiency.
- Connect & integrate IT & OT data from across the plant
- Identify the root cause of downtime events or quality issues.
- Investigate process issues with real-time trending tools.
- Visualize historical data using scatter plots, histograms, & more.
- Uncover data points to be modeled or calculated
- Manipulate large data sets and quickly analyze long-term production data.
Develop Optimized Process Models
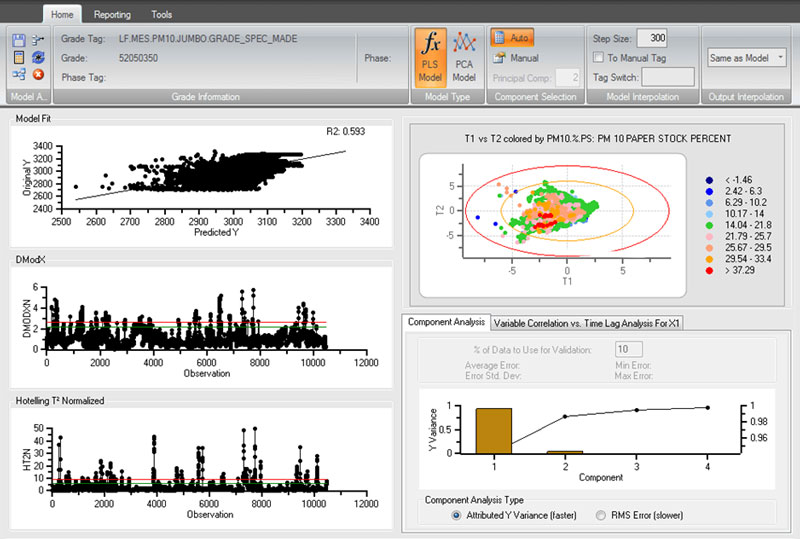
Develop models and calculations to drive process improvement. Read live data, such as temperatures and pressures, from the plant and use them to calculate estimated quality values from user-entered models.
- Calculate real-time variables for energy cost, etc.
- Predict process variables using PLS & PCA modeling tools.
- Approximate unmeasured values using soft sensors.
- Diagnose equipment issues to improve OEE.
- Anticipate upcoming process issues & take action before they occur.
Build Solutions to Drive Continuous Improvement
Engineer creative solutions to costly process issues. dataPARC provides the tools you need to develop real-time process monitoring and controls for full process visibility, early fault detection, process deviation warnings, and continuous improvement.
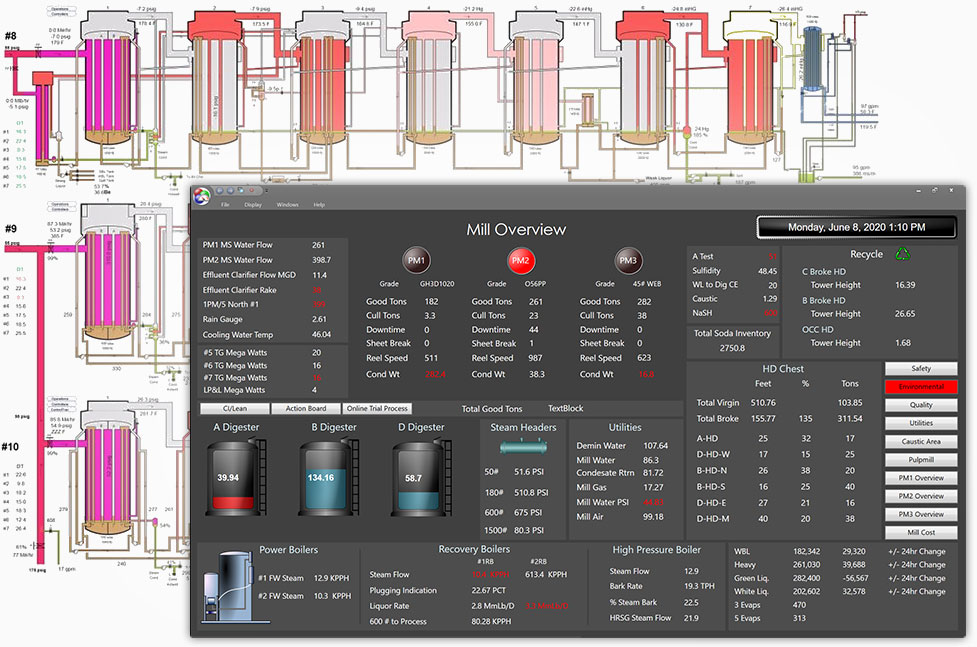
- Configure custom displays to share across your organization.
- Design real-time dashboards using 5000+ pre-built graphic objects.
- Perform 5 why analysis with integrated root-cause analysis tools.
- Create digital twins to explore the outcome of process optimization strategies.
Make Your Changes Stick
Embed changes and ensure sustainability of improved processes. dataPARC allows operators to closely monitor adjusted processes and make proactive decisions to reduce variability and ensure consistent product runs.
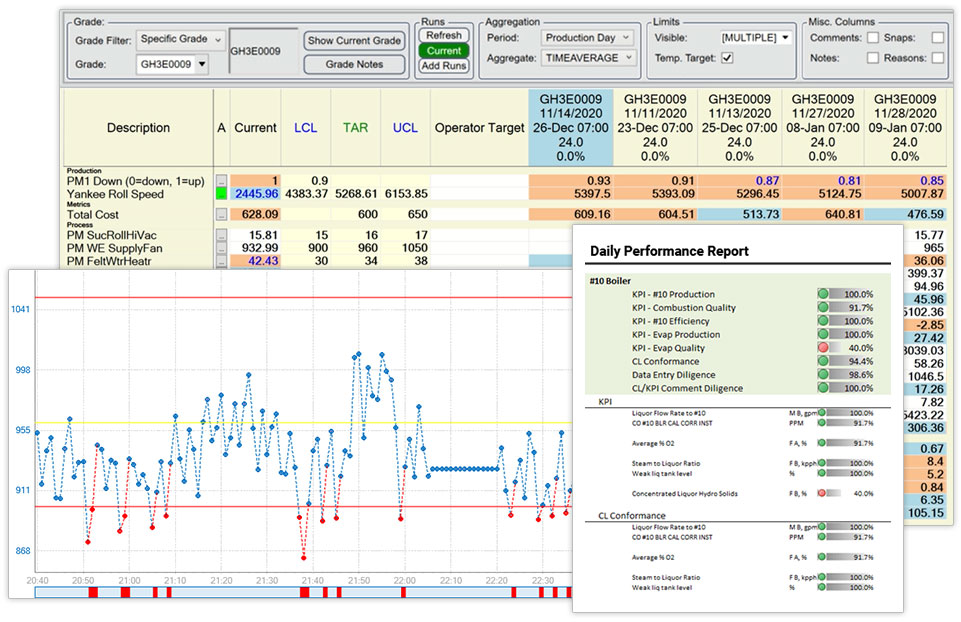
- Compare current process variables against target operating range.
- Alert key personnel when processes begin to deviate from target.
- Create limits to target specific product runs or grades.
- Report consistency of new processes.
Featured Case Study
Kapstone Paper
The global containerboard market is highly competitive, making process optimization essential to a paper mill’s survival. KapStone’s technical team turned to dataPARC to help them centerline their process, identify golden runs, and reduce costs.
Powering Practical Analytics Solutions for 25+ Years
We were trying to optimize the largest facility in our company and PARCview allowed us to overlay data – both lab and process – to break down perceptive barriers and make data-driven decisions.

Stan Case
Plant Manager – Amalgamated Sugar
Our investment in dataPARC is allowing us to focus on system optimization as we leverage the data we are now capturing.

Tyler Fedun
Director IT Operations – Energy Transfer
We make a lot of different different grades of paper. In order to maximize the dollars for each run, we use dataPARC’s centerline tool to find ‘golden runs’ and those become our target each time we run a grade.

Pami Singh
Director Process Optimization
The World’s Largest Manufacturers Depend on dataPARC
Related Solutions
Tackle common manufacturing challenges with PARCview’s out-of-the box functionality.
Quality Control
Real-time quality control tools for continuous or batch manufacturing processes.
Additional Features
dataPARC is a flexible industrial analytics toolkit built upon the promise of easy data acquisition & integration. dataPARC’s core building blocks can be used to build any applications to meet your needs.
Dynamic Alarms & Notifications
Use dataPARC’s rule-based alarm engine to build smart alarm definitions that reliably detect compliance events, including data loss, real time, and aggregate exceedance of regulation limits. Forward alarm event data to PARCview’s Logbook, and send notifications via email or SMS.
Custom Report Builder
PARCview’s highly configurable scripting and scheduling application can schedule and deliver recurring reports or other key data to management and other decision-makers. Create event-triggered reports, dashboard report delivery, & scheduled reports.
Excel Add-In
Designed to automate common or tedious Excel tasks and make it easy to build reusable reports, PARCxla enables users to spend more time making important decisions and less time wrestling with data.
Manual Data Entry
PARCgraphics Designer’s form-based MDE tools offer a platform for constructing custom data entry screens. Enter data against a record from anywhere within the dataPARC environment, across multiple MDE pages, PCs, and locations.
Batch Analysis Tools
Arrange multiple batches by product into a comparison or consecutive view. Search for historical batches based on identifying information, such as batch ID or product label. Determine variability at any point in the batch using Run Trend analysis.
First Class Support
Build control charts (x-bar, range, standard deviation, etc.) from existing sources or PARCview formulas. Define simple min/max limits, choose from Western Electric Rules or custom logic. Limits can be managed natively in dataPARC or imported from a 3rd party database.
Download Our Overview Datasheet
Click the link below to receive a FREE overview on the benefits of using dataPARC to transform critical data into visual information for timely decision-making.