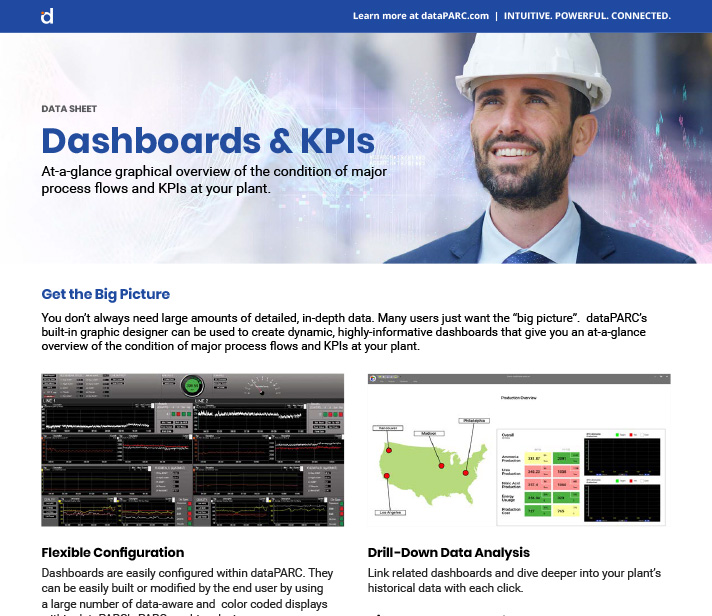
Dashboards & KPIs
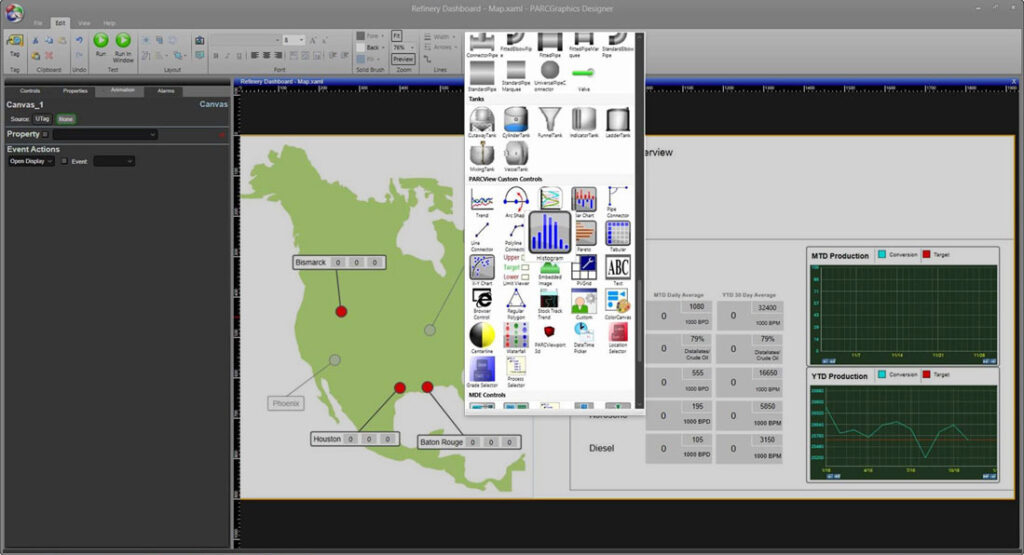
Our built-in graphic designer can be used to create dynamic, highly-informative dashboards that give you an at-a-glance overview of the condition of major process flows and KPIs at your plant.
Enhance Decision Making and Understanding of Data
Dynamic Animation
Create animated displays by associating object properties (size, color, background, foreground) with tag values.
View Data from Any Source
Build dashboards with data from multiple physical sites or from various processes in a single display. Data from traditionally isolated data silos, such as lab quality data, or ERP inventory data, can be pulled in and presented side-by-side for analysis in a single display.
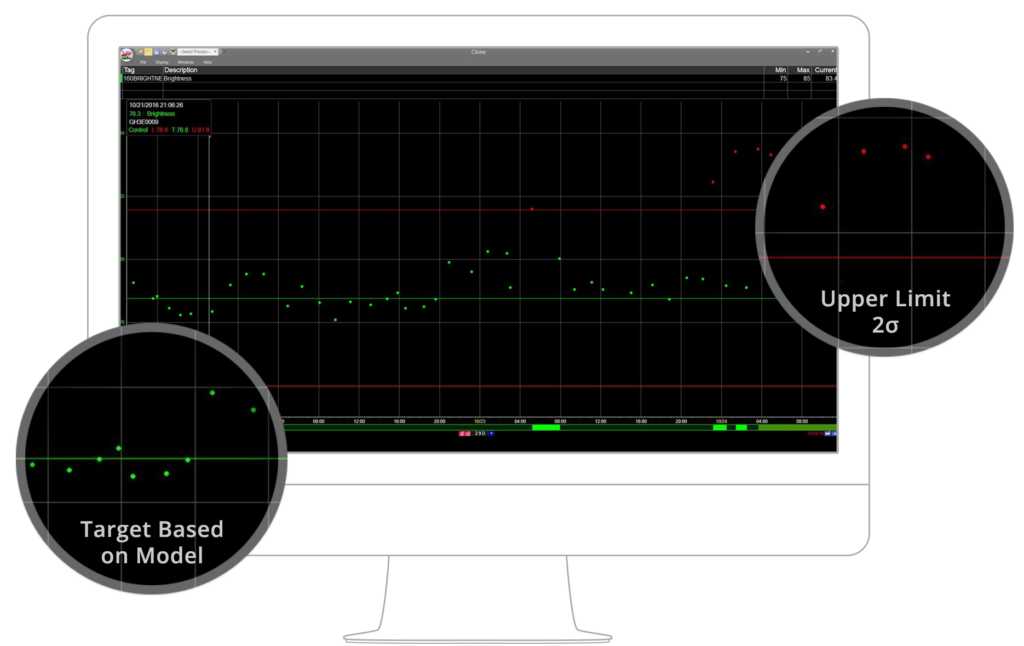
Define Targets & Limits
With data, context is critical. PARCview’s robust limit and target management allows KPI values to be viewed in the correct context. Easily define KPI targets and set limits based on actual process tags to ensure all your dashboards are providing you with meaningful data.
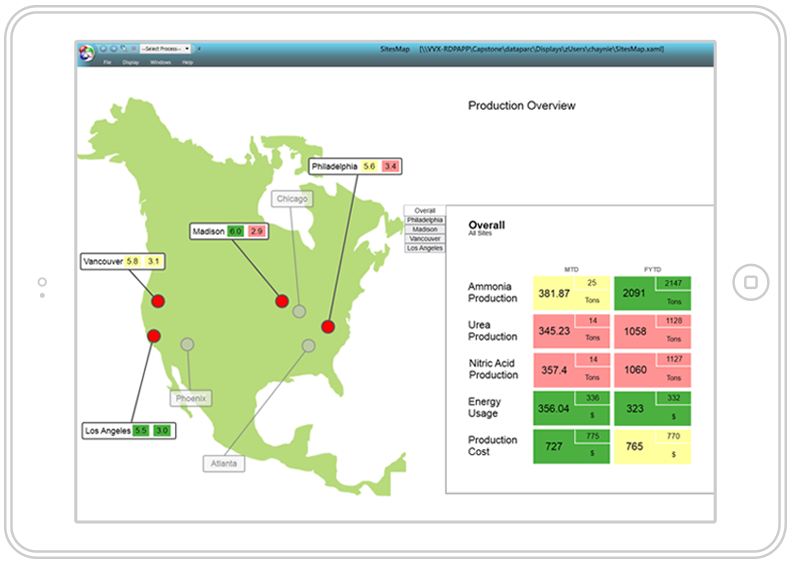
Drill-Down Data Analysis
Link related dashboards and dive deeper into your plant’s historical data with each click.
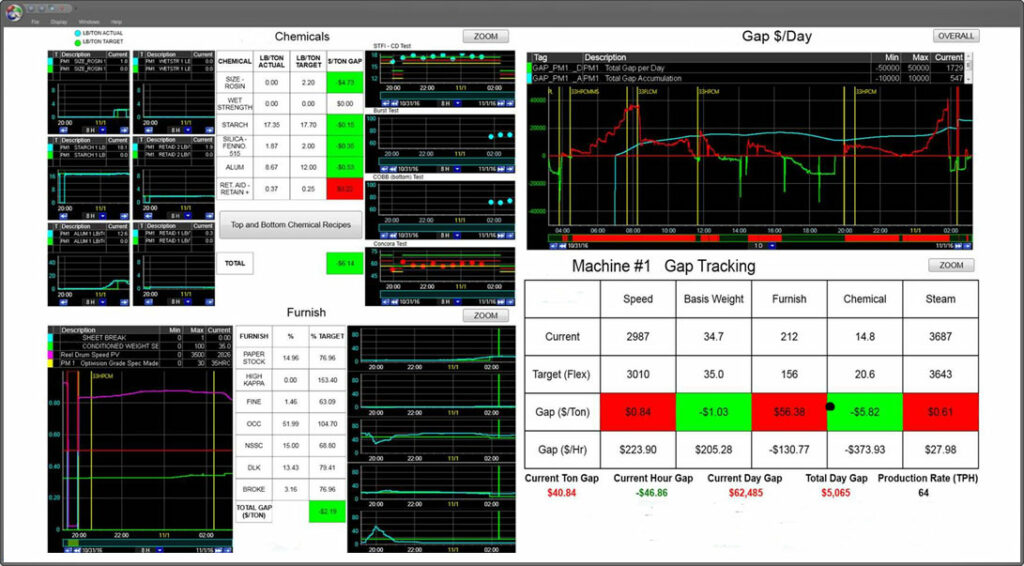
Flexible Configuration
Dashboards are easily configured within dataPARC. They can be easily built or modified by the end user by using a large number of data-aware and color coded displays within dataPARC’s PARCgraphics designer.
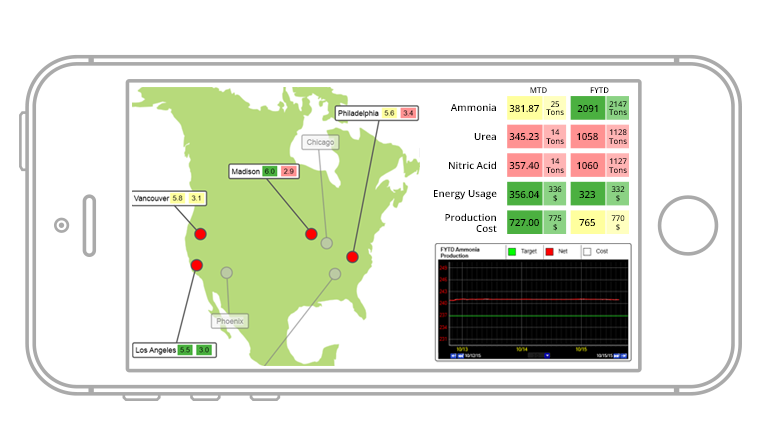
Access Dashboards On-The-Go
Access the same crucial dashboards shown on a six foot flat screen on the production floor from any mobile device. dataPARC graphic displays are based on Microsoft WPF and XAML technology, meaning that once a display is built, everyone can be sure they’re making decisions on the same data.
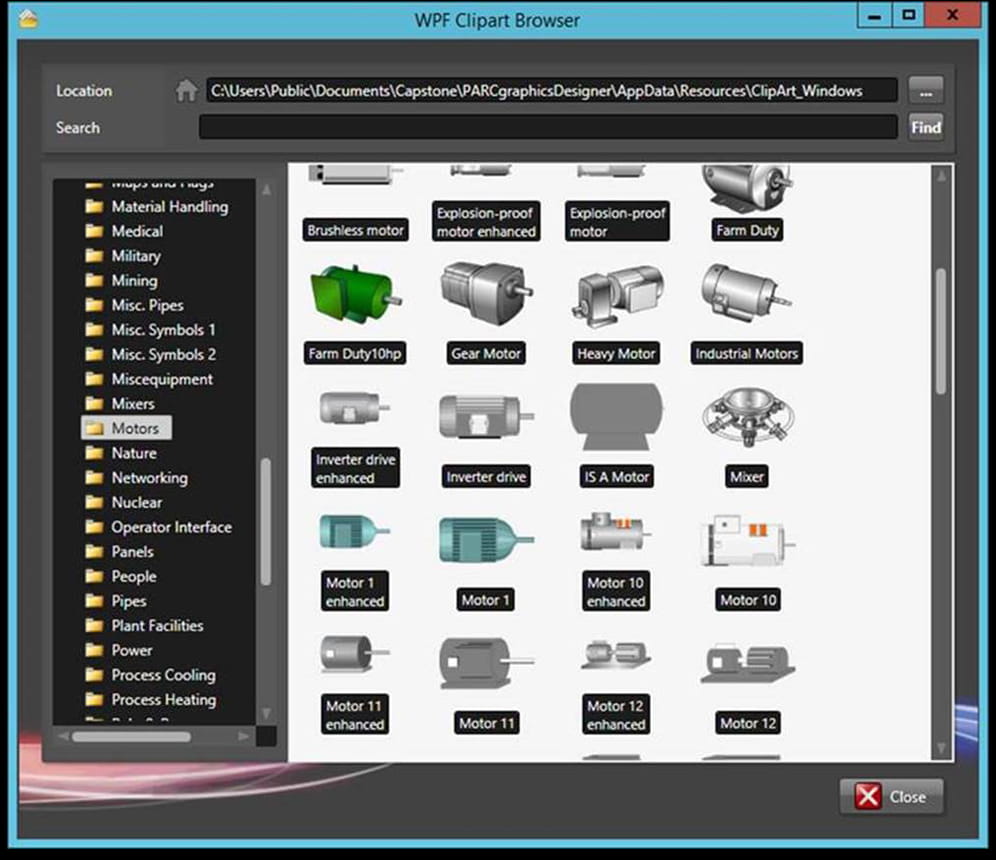
Industry Standard Graphics Library
With our industry standard graphics library, PARCgraphics Designer offers a graphics library based on Microsoft® WPF and XAML, with over 5000 graphic objects and controls.
Download Our Datasheet
Click the link below to get your FREE download of our dashboards datasheet.