#1 PI Server Data Visualization Toolkit
Superior ad-hoc analytics tools, faster performance, lower cost… Just a few of the reasons dataPARC is the best choice for PI historian data visualization & analysis. See why hundreds of major manufacturers choose to use dataPARC tools on top of their PI Historians.

Native PI Server Integration
It couldn’t be easier to connect to your existing PI Historian data. Get up and running in minutes.

Superior Ad-Hoc Analytics
There is no better toolkit for root-cause analysis & process troubleshooting.

Unlimited User Count
Scale & save. dataPARC allows you to add unlimited users for one low price.
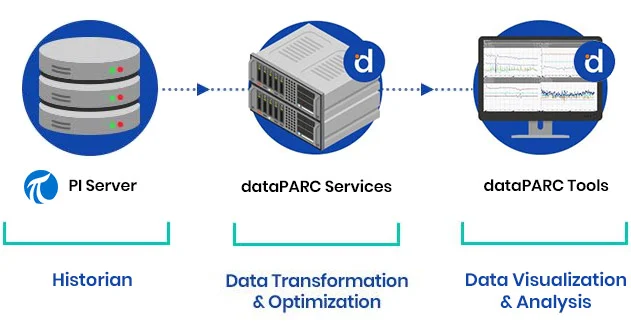
Seamless PI Historian Connectivity
Get next-gen data visualization & analytics tools without ripping & replacing your existing PI Historian or disrupting your current IT infrastructure.
- Maximize your investment in PI Server
- Interface with PI Server via AF or SDK.
- Get connected in less than 2 hours.
Dive Into Your Data
Give your operators, engineers, & SMEs the power to develop data-driven solutions to your most challenging process issues. Give them PARCview – the most flexible, powerful, & easy-to-use PI analytics toolkit available.
- Investigate process issues with real-time trending tools.
- Visualize historical data using X-Y charts, histograms, & more.
- Combine disparate data into a single trend, dashboard, or report.
- Diagnose equipment issues to improve OEE.
- Predict upcoming process issues & take action before they occur.
Produce Answers. Faster.
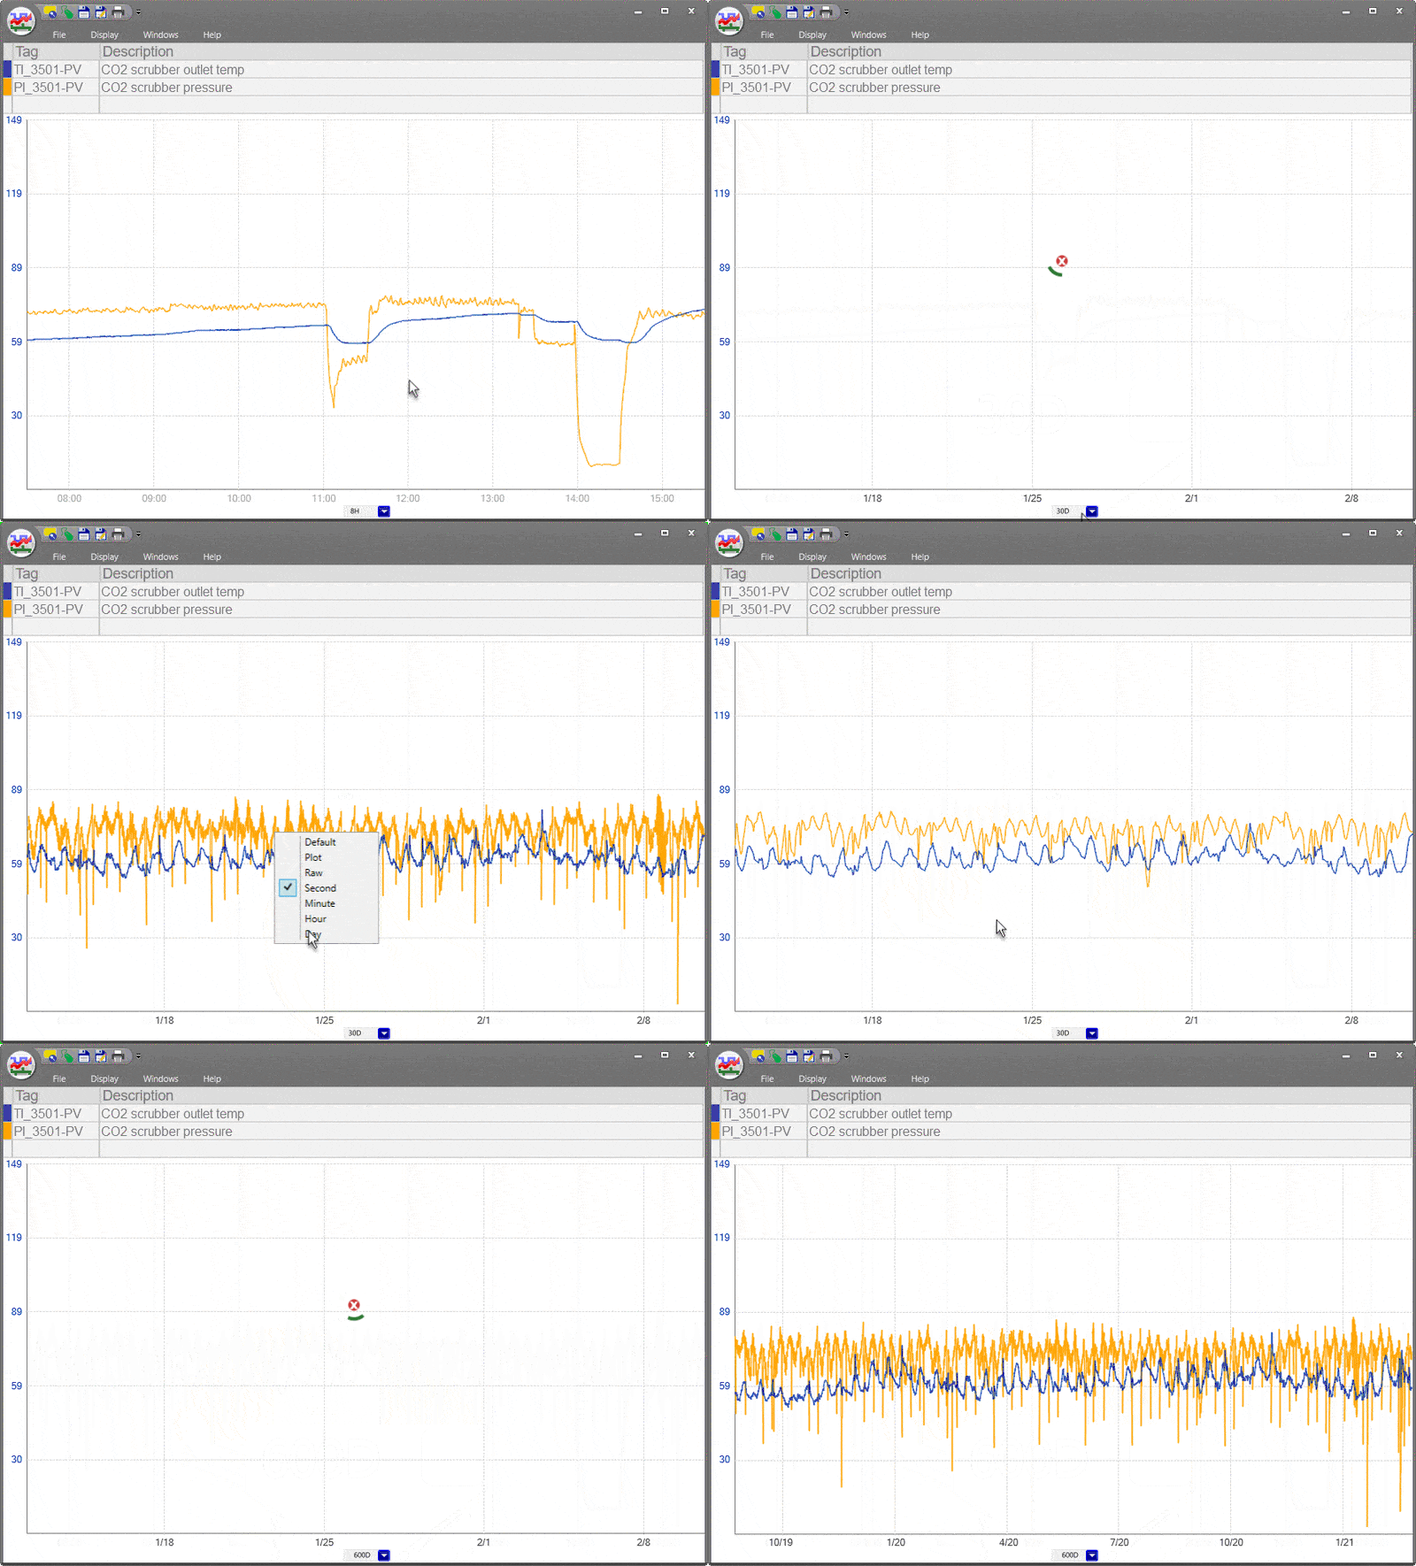
Speed up your data analysis capabilities. dataPARC’s proprietary high-performance archive engine connects to PI Server and returns hours, days or months of high-resolution data within seconds, so you can get right to troubleshooting.
- 200x Faster retrieval of long-term data (>30 days)
- 2x Faster retrieval of short-term data (<24hrs)
- Reduce storage. No double-storing data.
See The Big Picture
Give operators, engineers, & management insight into current operating conditions. Build real-time dashboards & displays to monitor equipment status, site-level process flows, or enterprise-wide productions KPIs.
- Configure custom displays that represent your process.
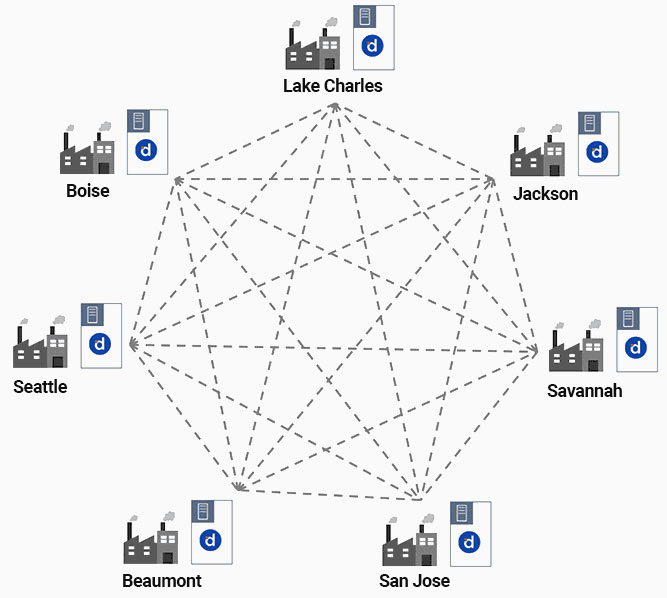
- Display data from any source (or site) in one view.
- Access dashboards remotely, from any mobile device.
- Design displays using 5000+ pre-built graphic objects
- Import existing graphics from PI, IP.21, & more.
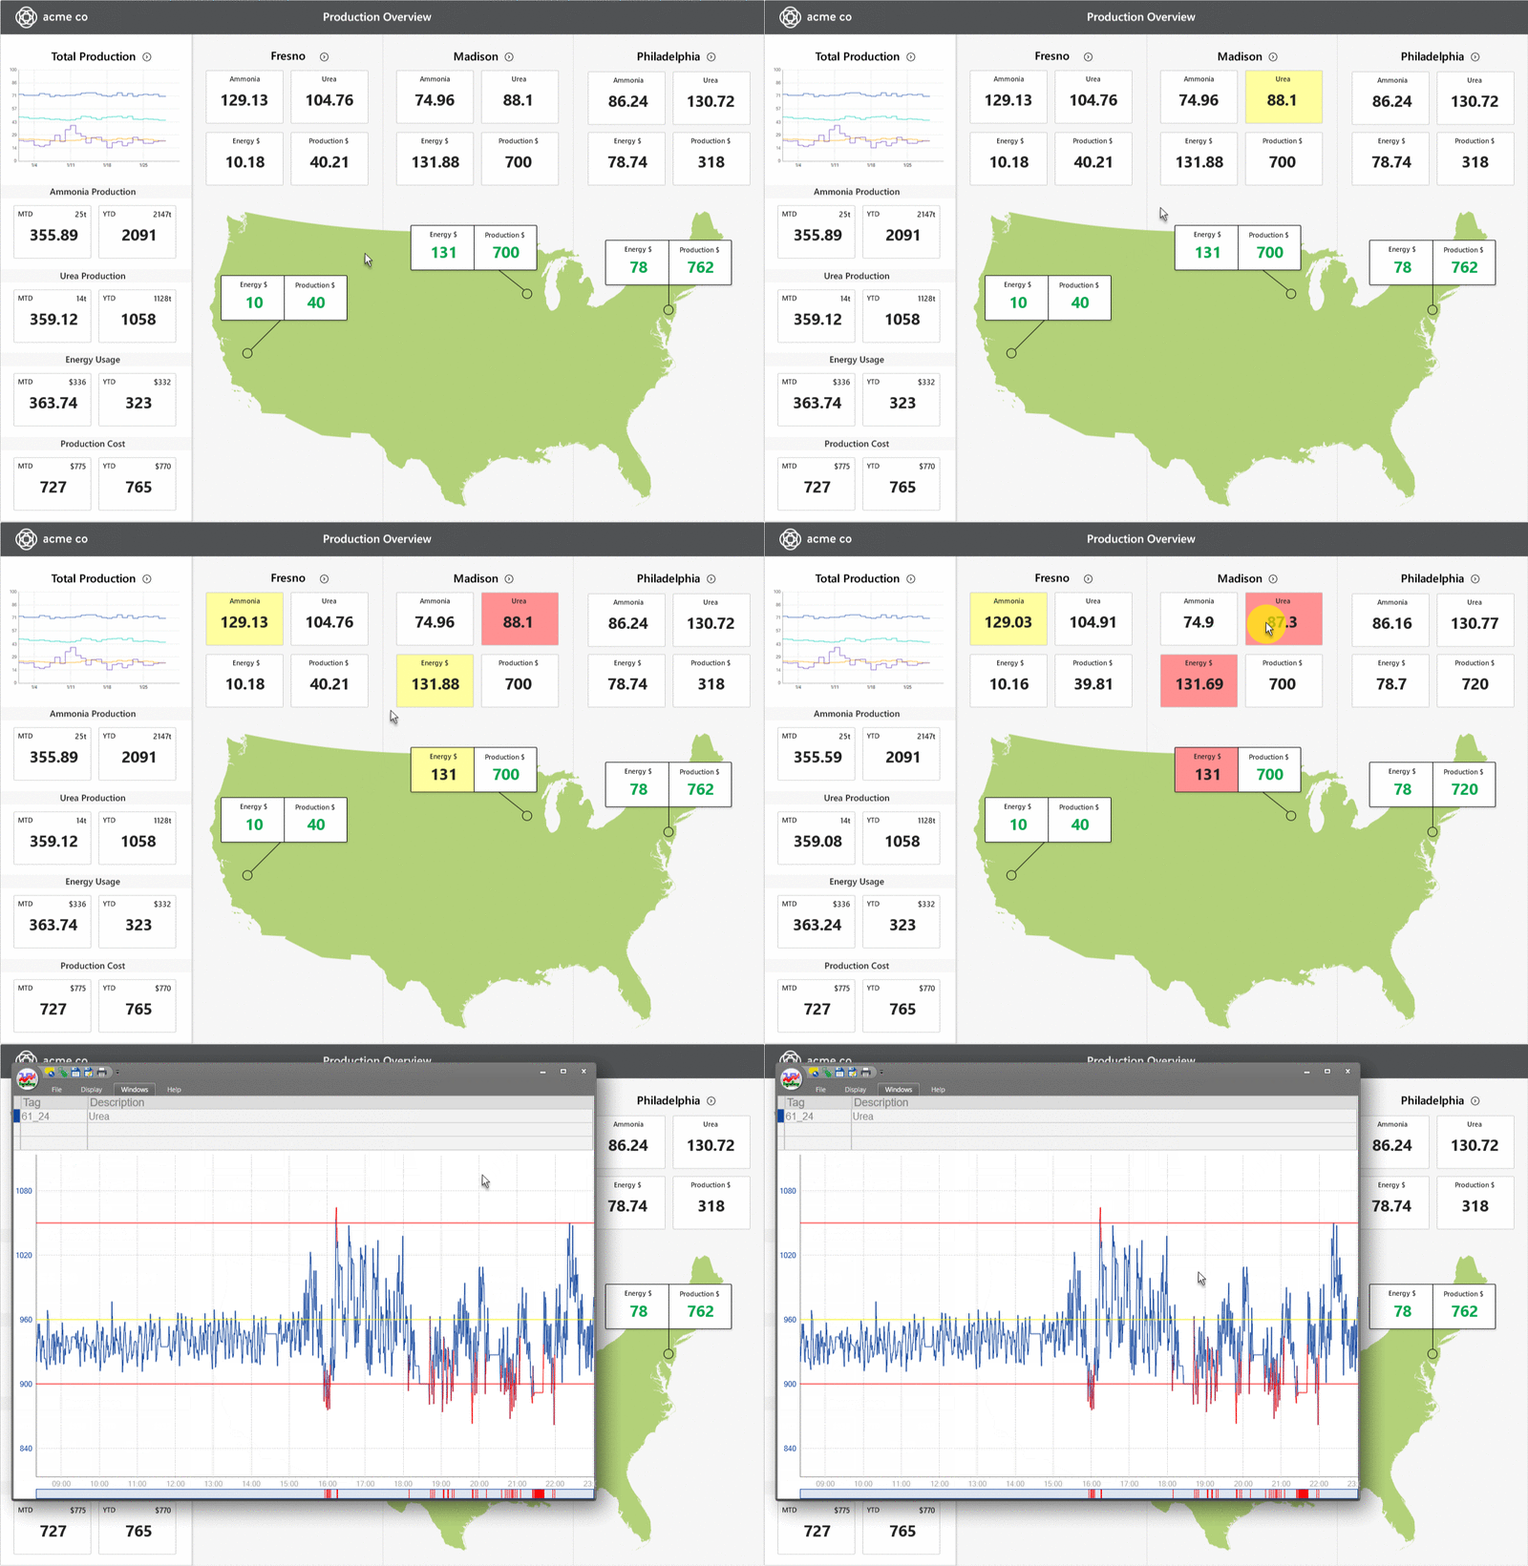
Migrating From ProcessBook?
Don’t start over from scratch. dataPARC offers a clear migration path for ProcessBook users who want to continue using their legacy displays & graphics.
You can easily migrate all your data from your existing PI System:
- Bulk import all of your important ProcessBook graphics.
- Retain display linking in imported graphics ∧ displays.
- Don’t disrupt your existing process data flows.
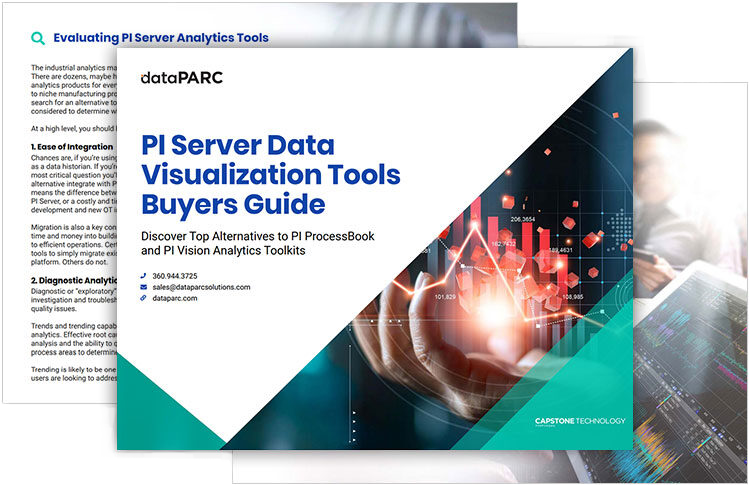
Download the PI Server Data Visualization Buyer’s Guide
Understand your options and learn what factors to consider when replacing ProcessBook & PI Vision analytics toolkits.
This comprehensive guide covers:
- Criteria for evaluating PI replacement options
- Integrating with PI Server
- Diagnostic analytics capabilities
- Operations management capabilities
- Cost/pricing breakdowns
The World’s Largest Manufacturers Depend on dataPARC


Powering Practical Analytics Solutions for 25+ Years
We were trying to optimize the largest facility in our company and PARCview allowed us to overlay data – both lab and process – to break down perceptive barriers and make data-driven decisions.
Stan Case
Plant Manager – Amalgamated Sugar
Our investment in dataPARC is allowing us to focus on system optimization as we leverage the data we are now capturing.
Tyler Fedun
Director IT Operations – Energy Transfer
We make a lot of different different grades of paper. In order to maximize the dollars for each run, we use dataPARC’s centerline tool to find ‘golden runs’ and those become our target each time we run a grade.
Pami Singh
Director Process Optimization
PI Server Data Visualization Buyer’s Guide
Learn how to evaluate ProcessBook & PI Vision alternatives, and discover some of the best PI Server data visualization tools available today.
