Case Study
W.R. Grace Sorocaba
Find out how the W.R. Grace plant in Sorocaba used operator-focused PARCview dashboards to identify process deviations in real time, reducing production downtime and product waste, with an estimated ROI of $7,000 per month.
Sorocaba’s Plant Challenges
W. R. Grace’s Sorocaba plant set out to improve visibility across their process areas and equip operators with tools to make faster, more confident decisions. While the team had access to process data, the information was scattered across multiple systems and difficult to interpret in real time. Operators needed a clearer, more intuitive way to see what was happening across the production line, and react quickly when issues arose.
“All of these dashboards are in the operator room. We designed them specifically so operators could monitor the process live and react faster.”
Mariana Simon, Production Coordinator – WR Grace Sorocaba
Building Dashboards That Match How Operators Work
With assistance from dataPARC, the Sorocaba team designed two key types of operational dashboards in PARCview, each serving a distinct purpose in the control room:
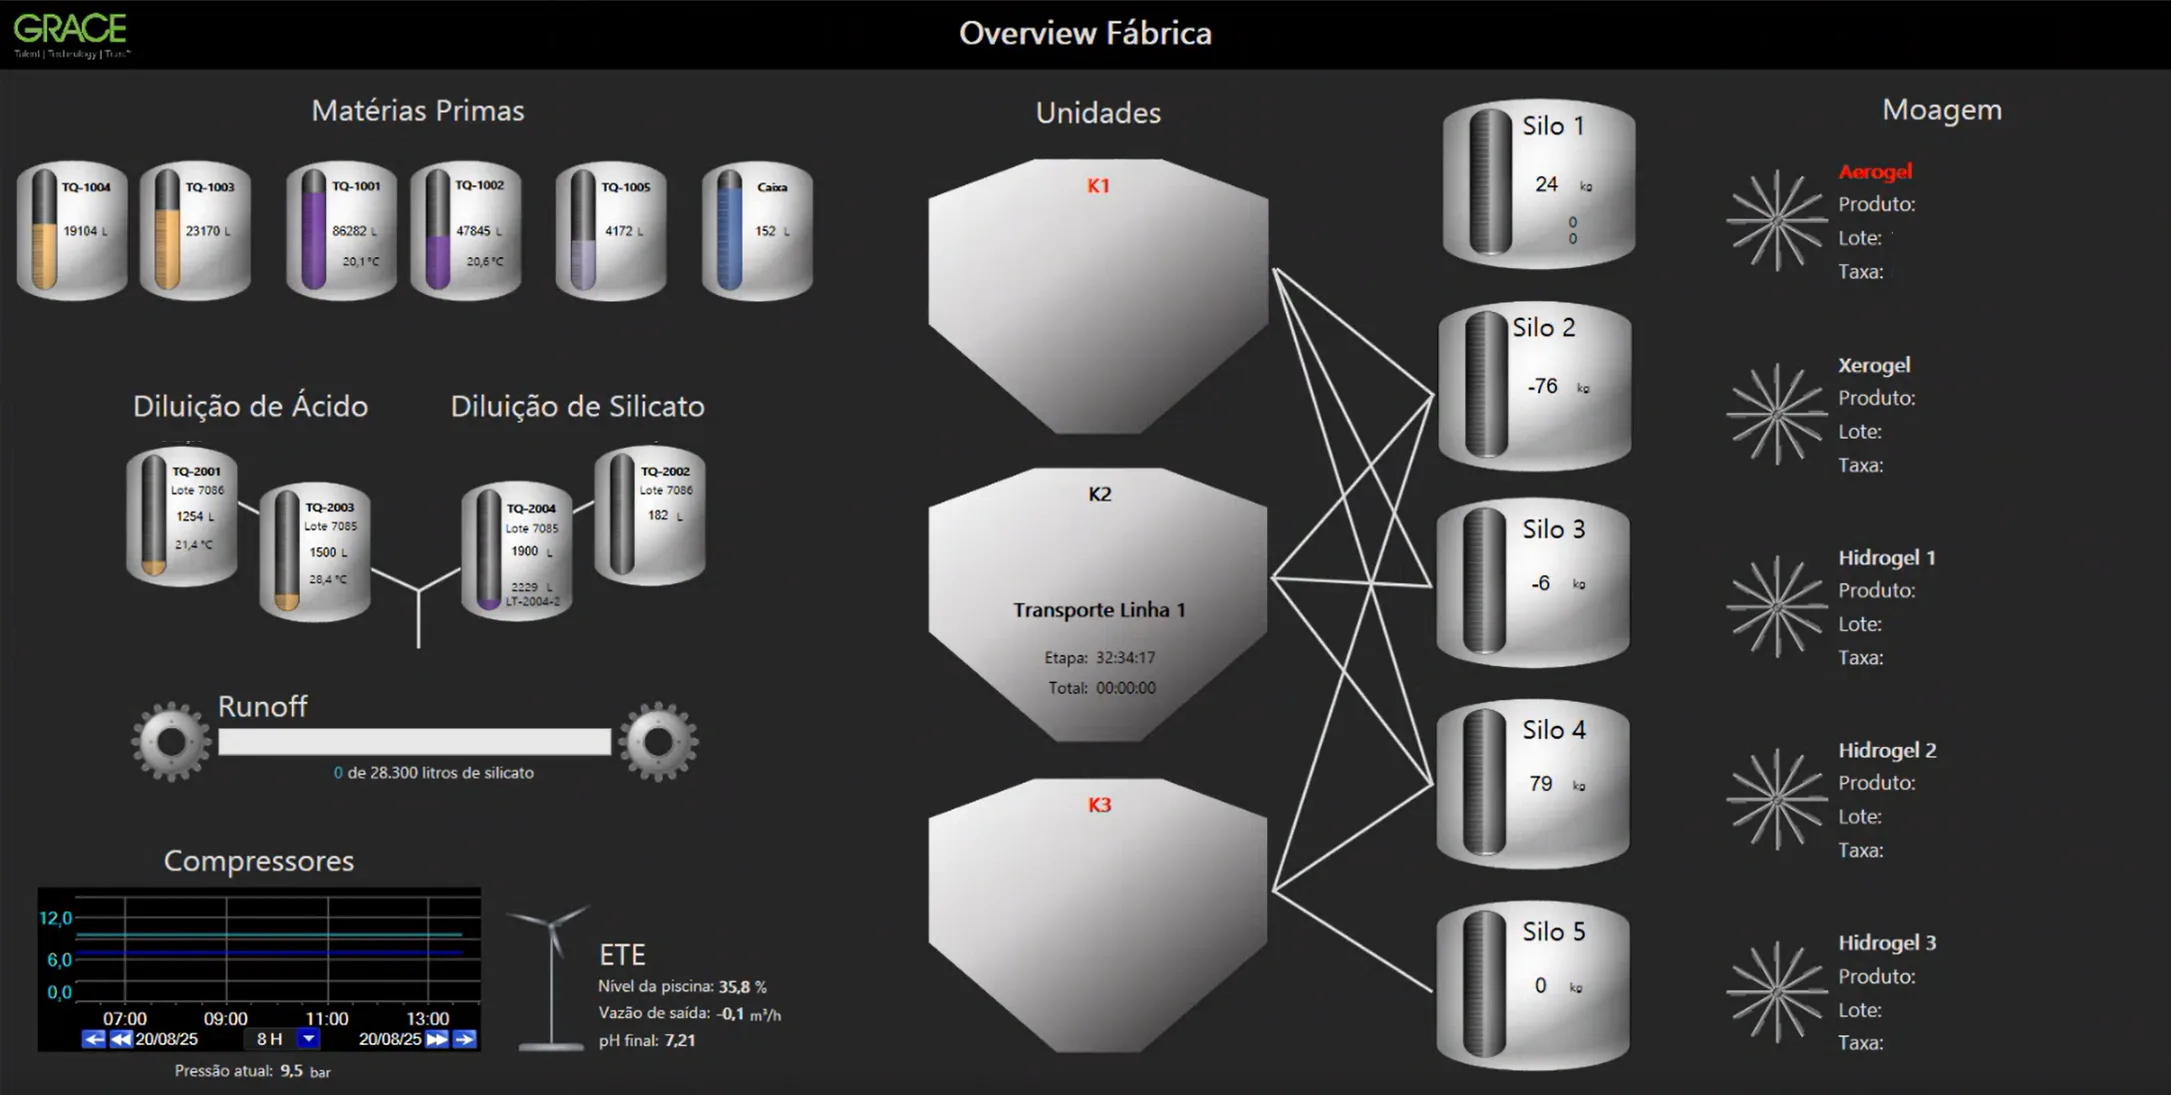
1. Area Overview Dashboards
These high-level graphics give operators a complete picture of the process, showing:
- Raw Material Handling
- Dilution tanks
- Reactors
- Downstream lines and flow paths
Operators can instantly see how the entire system is behaving without switching screens. To reduce visual noise, the team used calculation-driven flow indicators that automatically show or hide based on actual process movement — allowing operators to focus only on active operations rather than all the possible pathways.
2. Unit Dashboards
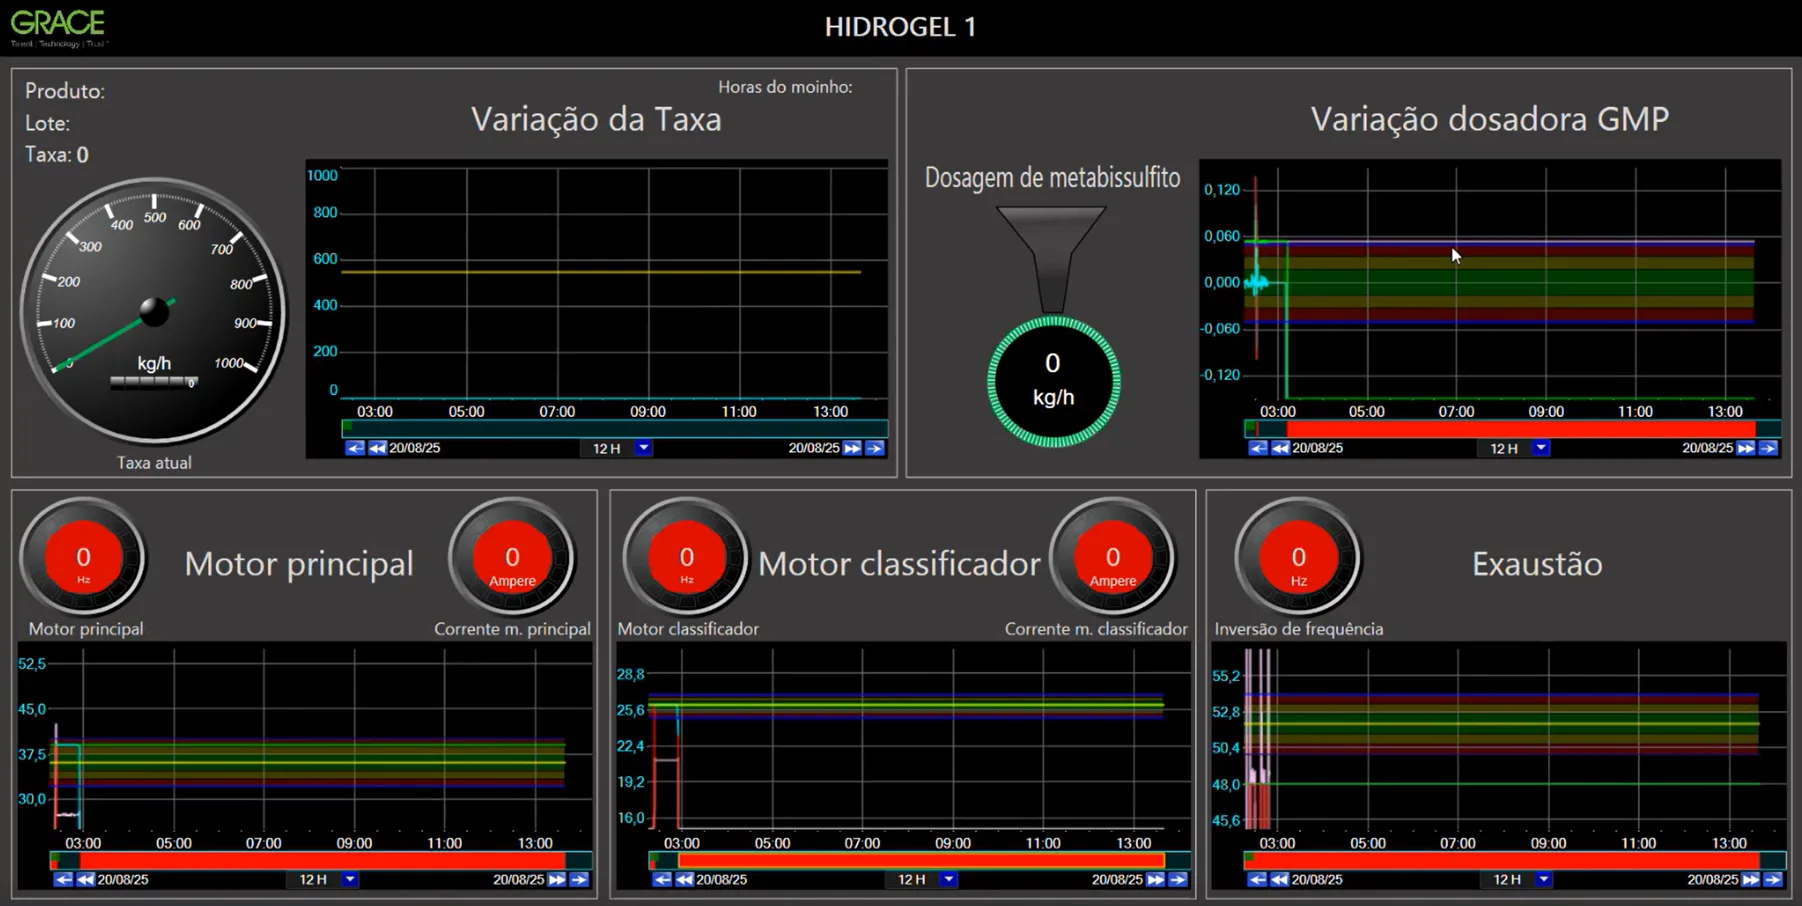
When operators need to drill deeper, unit-level dashboards provide targeted visibility with:
- Trends
- Gauges
- Color-coded limits
- Key performance values
These displays help operators diagnose issues quickly and understand the condition of a specific unit within the broader process.
Transforming the Control Room with Real-Time Visibility
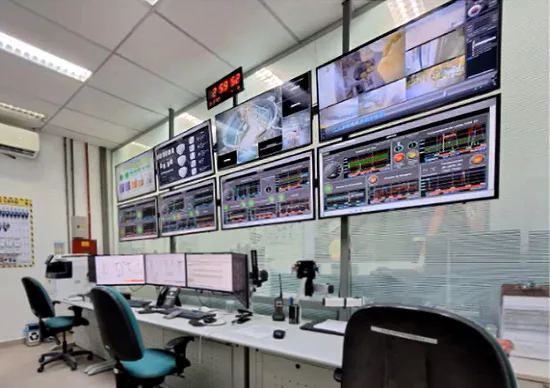
To ensure dashboards were always accessible, Grace installed an eight-screen wall display inside the control room. These screens combined:
- Live Dashboards
- Trends
- External systems (such as cameras)
Operators now monitor the entire process from a central command center and use PARCview both for decision-making and communication, including sharing comments, documenting alarm events, and coordinating with engineers and vendors.
Measurable Impact on Performance and Waste Reduction
After implementing the dashboards, the Sorocaba team saw major improvements in operational stability and waste reduction and communication.
Reduced Flow Interruptions
Before dashboards were introduced, flow interruptions lasted hours and often required intense involvement from shift leaders. These interruptions directly contributed to waste in the final product.
With real-time visibility, operators could detect deviations earlier, intervene faster, and maintain consistent flow. Interruptions decreased dramatically, in some cases approaching near-continuous operation, leading to notable reductions in product waste. For this area alone, the plant estimated an ROI of approximately $7,000 per month.
Improved Vendor Collaboration
Previously, operators and engineers struggled to demonstrate patterns of good and poor runs to vendors because data was hard to extract and visualize. With PARCview’s trend tools, the team could now present clear, limit-based graphs showing variability. This visibility prompted vendors to investigate and correct issues, resulting in more stable runs and a significant reduction in variability.
“Operators can now see variations in real time. If something goes outside the limits, they know immediately and can adjust the process before it escalates.”
Mariana Simon, Production Coordinator – WR Grace Sorocaba
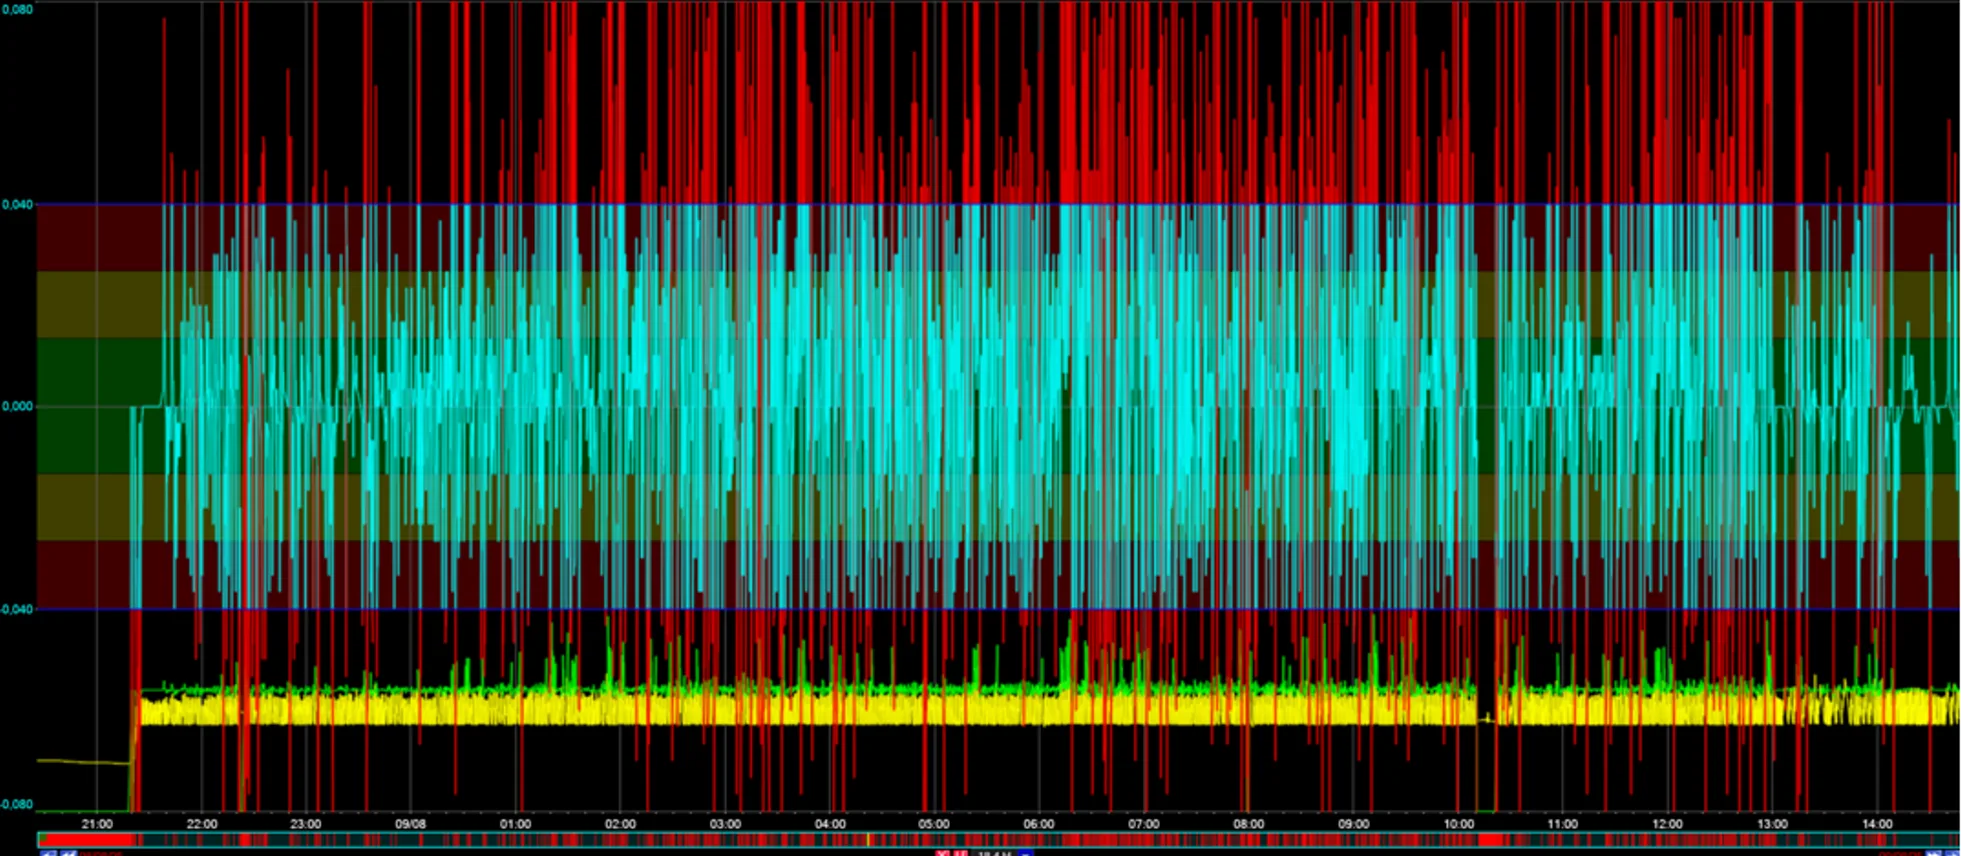
Before
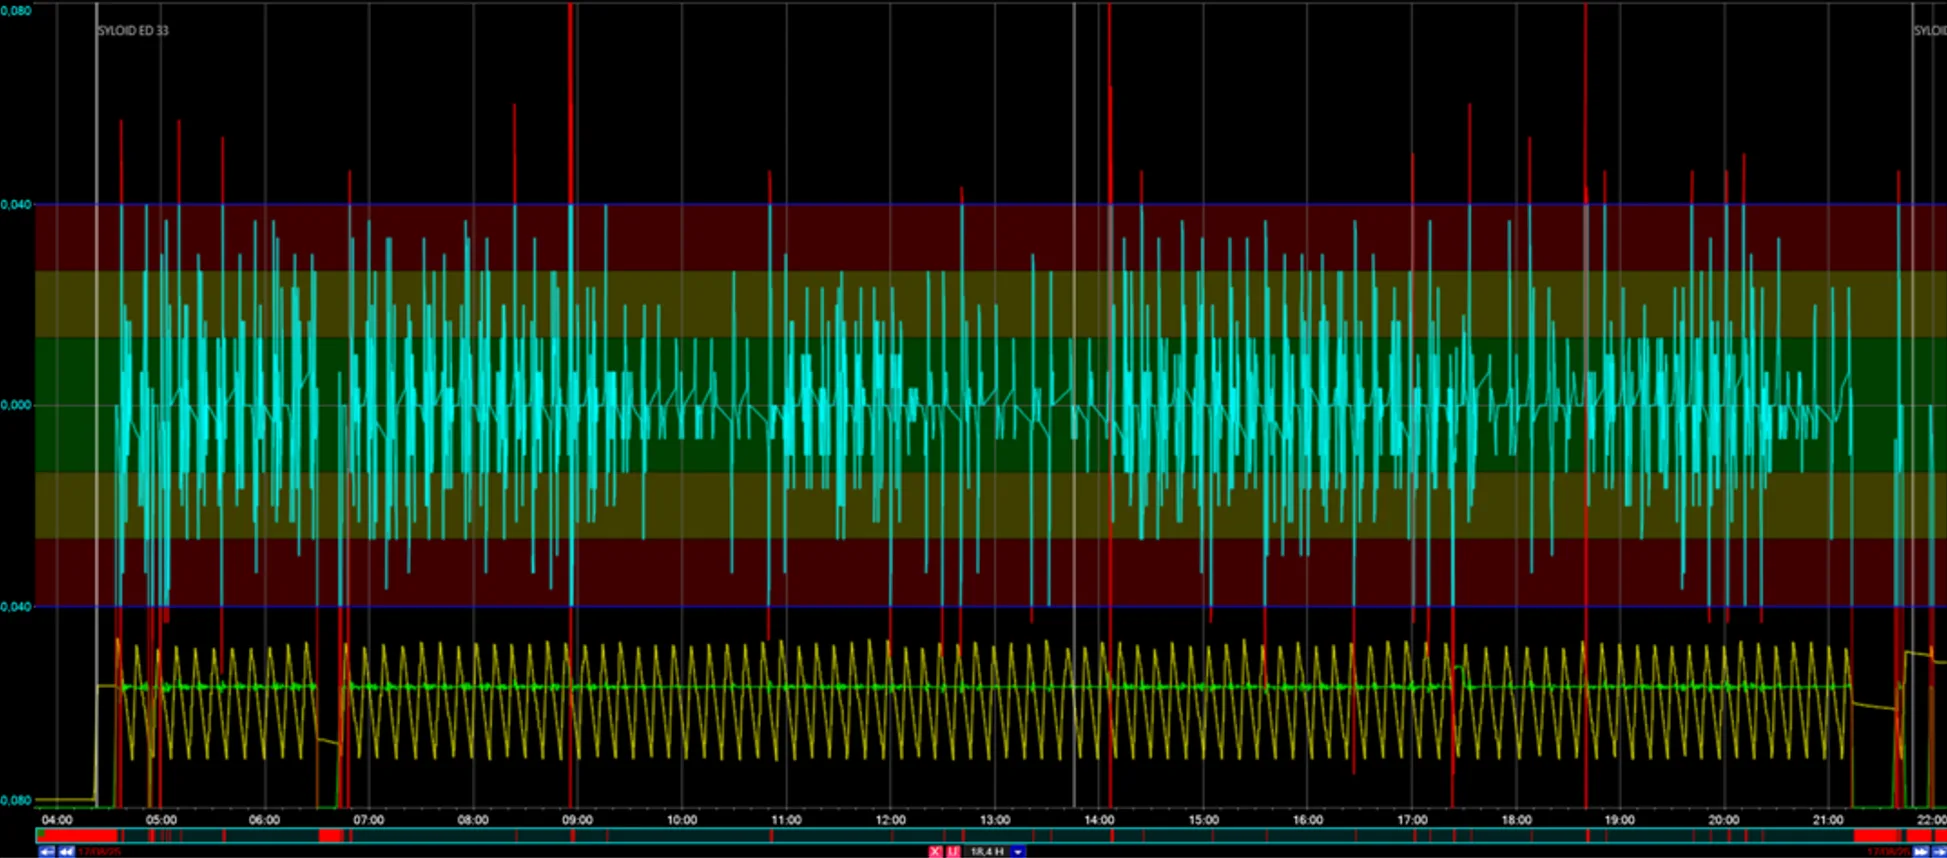
After
More Success Stories

Energy Transfer
See how Energy Transfer underwent a complete digital transformation, saving time and money and enabling better decision-making.
Western Plains Energy
See how Western Plains Energy developed data-driven ideas and improved product quality and process efficiency at its ethanol plant.

Drax Biomass
See how Drax Biomass developed a company-wide data management strategy for its pellet production operations.
W.R. Grace Case Study
Find out how the W.R. Grace plant in Sorocaba used operator-focused PARCview dashboards to identify process deviations in real time, reducing production downtime and product waste, with an estimated ROI of $7,000 per month.