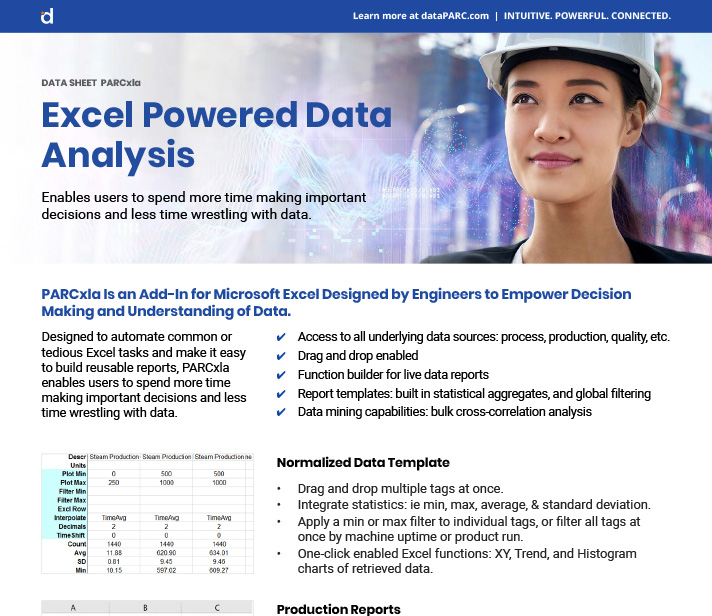
Excel-Powered Data Analysis
Designed to automate common or tedious Excel tasks and make it easy to build reusable reports, PARCxla enables users to spend more time making important decisions and less time wrestling with data.
Enhance Decision Making And Understanding Of Data
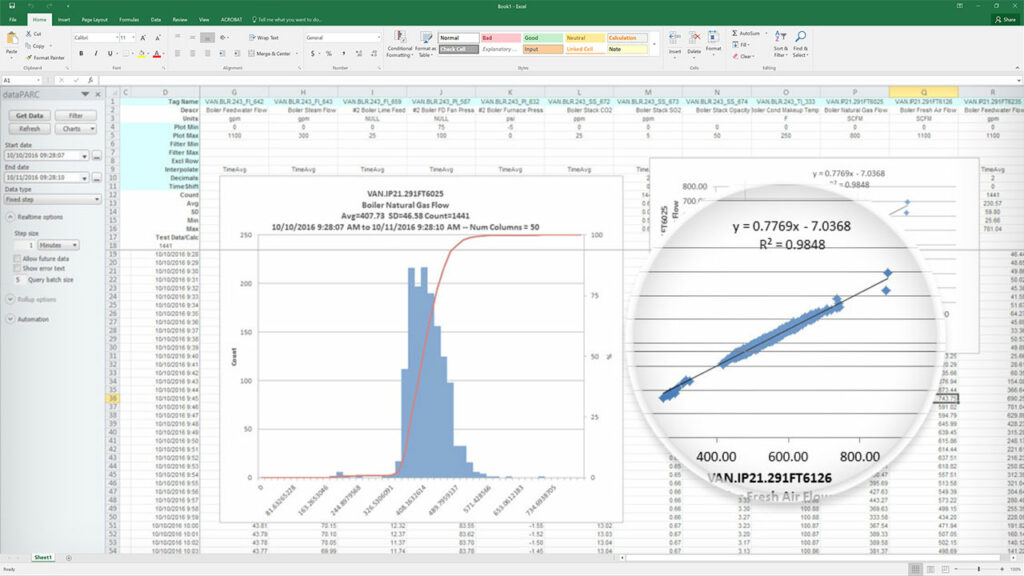
Normalized Data Template
Easily create Excel charts from the normalized data with the following:
- Drag and drop multiple tags at once
- Integrated statistics (min, max, average and standard deviation)
- Apply a min or max filter to individual tags, or to all tags at once by machine uptime or product run
- One-click enabled Excel functions: XY, Trend & Histogram charts of retrieved data
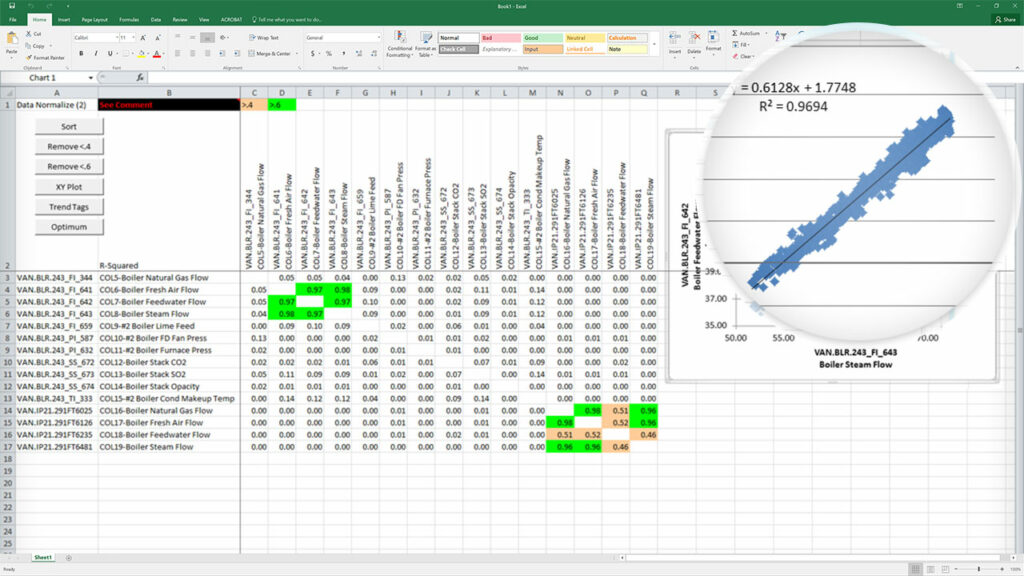
Data Mining with Cross-Correlation Function
Study the cross-correlation relationships (R² or R) of multiple tags simultaneously, with color-coded values to show the highest and lowest correlations. View scatter plots of the comparisons to drill into tag relationships.
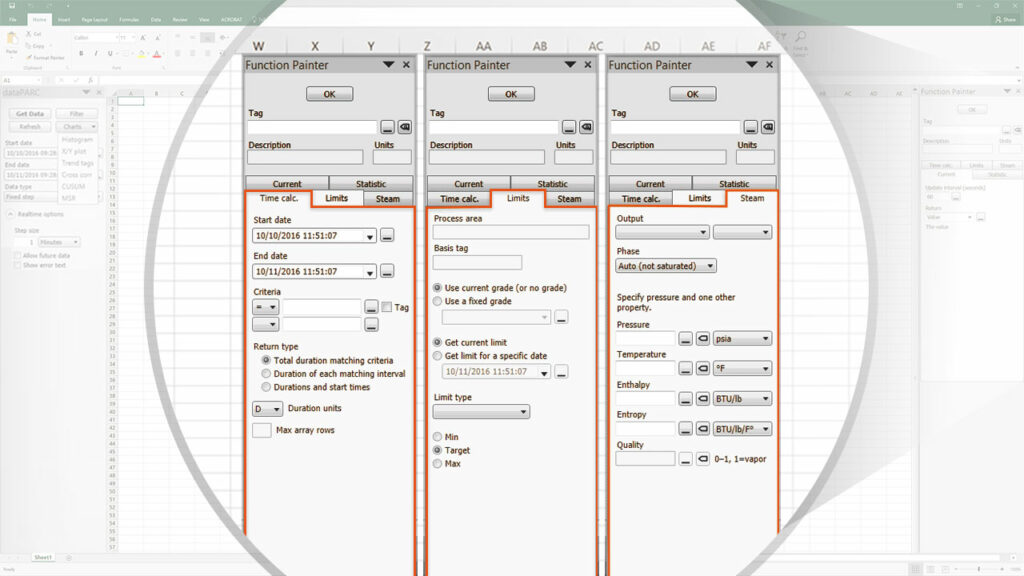
Production Reports
- Summarize data over any production period (shift, day, week, etc.)
- Use Function Painter to build live reports or schedule the report as needed
- Import data from entire dataPARC system (incident tracking, logbook comments, etc.)
Download Our Datasheet
Click the link below to get your FREE download of our PARCxla datasheet.