There are numerous KPIs options for tracking production and manufacturing. In this article, we will dive into different types of data used for manufacturing KPIs and share examples and formulas for 10 important manufacturing KPIs.
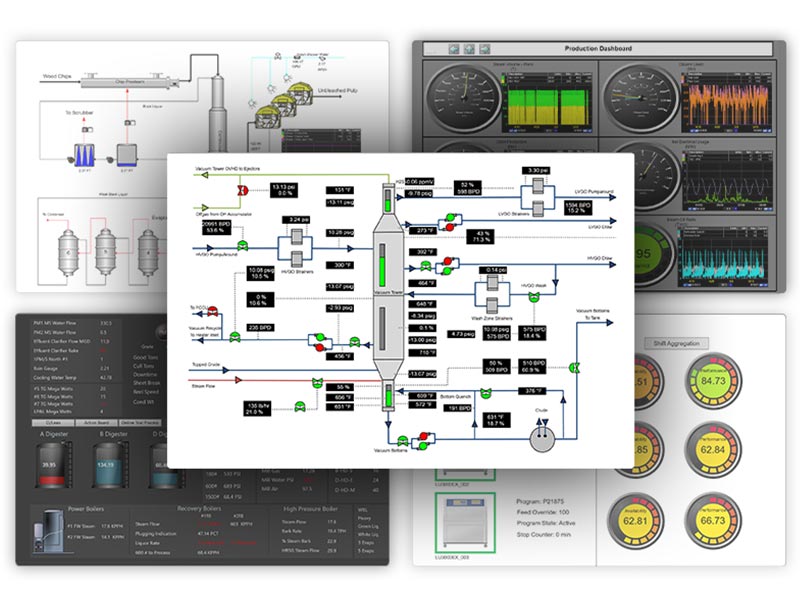
Build Real-Time Dashboards & Displays for Effective KPI Monitoring with dataPARC
Collecting Data for Manufacturing KPIs
Data is necessary for measuring manufacturing KPIs. There are three main types of manufacturing data used: Process, Environmental and Lab/Manual Data.
The type of manufacturing KPI will influence where the data should be coming from, however each data type has their own considerations to be aware of.
Process Data
Process data is any data in line or in-stream of production such as speed, temperatures, pressures, rate, etc.
This data updates frequently. The frequency can range from many points a minute to sub-second data points. High frequency data gives the flexibility to have a more focused measure and can show production values in real-time.
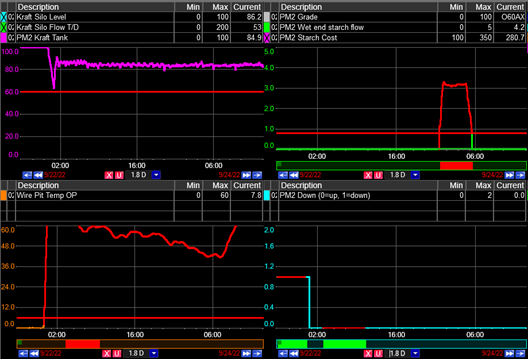
Such high frequency data is great for operators and many manufacturing KPIs such as throughput, changeover, OEE, and capacity utilization.
A limiting factor to process data is the physical sensors and their location on the machine. It could take a lot of effort to add a new sensor to the machine if there is an additional manufacturing KPI is request.
Environmental Data
Environmental data is helpful for ensuring the plant stays in compliance with emissions excursions, water usage, energy consumption, and waste management.
This type of data could need extra calibration or even require a third party company to inspect and certify the measurement.
State, or other regulations could require environmental data and reporting. The data here needs to be reliable and automated. The consequences of inaccurate data could be very costly for a company.
Environmental manufacturing KPI’s could require special reporting such as submitting monthly values to a government website.
Lab Data
Lab/Manual data is a necessary data collection category for quality and customer satisfaction data. Manual data can be used temporarily when trying to establish a new KPI. Manually record values to determine if the data from an in-line sensor is worth the effort.
Lab data identifies quality values used to sell good quality products to the customer. It helps ensure that products are consistent from batch to batch.
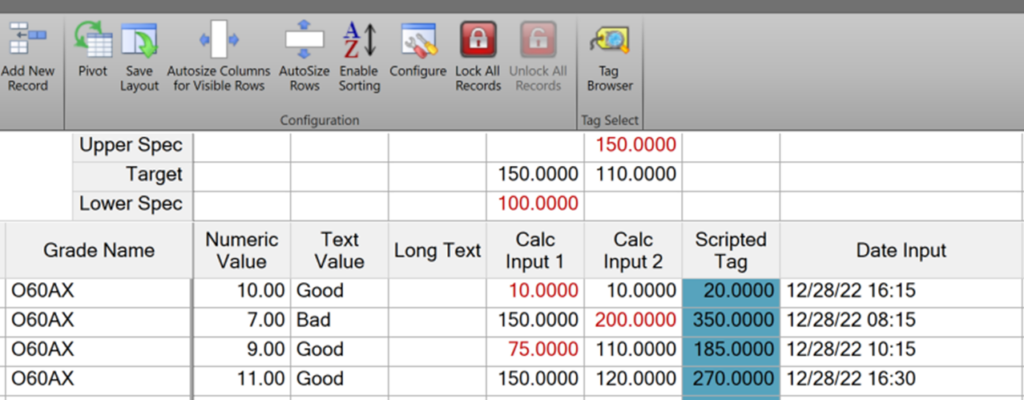
This is a PARCview lab entry screen (MDE). MDEs record numeric, text and date/time manual data. Dropdowns, calculations and restricted cells enhance the accuracy of data entry. Data accuracy is critical for manufacturing KPIs.
Some considerations when using Lab/Manual data for manufacturing KPIs. They can be infrequent and will not give a real-time value like process data. There is also more room for human error. This can be mitigated by adding dropdowns and selections rather than typing in a value; limiting value ranges in certain entries and including automations whenever possible.

Mastering Manufacturing Metrics: The ultimate guide to establishing, measuring, & reporting KPIs for peak plant performance.
Top 10 Examples and Formulas for Manufacturing KPIs
Manufacturing KPIs will vary from product to product, however there are some common ones that span the industries.
When trying to determine which manufacturing KPIs to track, be sure to start small. Ask, what variables provide value to the customer, to the company and to the employee?
KPIs should also have a mixture of leading vs. lagging indicators. A lagging measure reflects past performance, while leading measures are beneficial for gauging future performance. For more details, see Establishing Manufacturing KPIs.
As outlined in the previous section, there are a few different ways to collect data for manufacturing KPIs. In many cases, it is not enough to review this raw value. A formula or aggregation can be applied to come up with a meaningful measure.
Here are ten of the top manufacturing KPI examples and the KPI formulas often used for calculation:
1. Throughput
Throughput = Production Units / Time
Throughput is simply the amount of product that was produced in a given period of time. This is a standard manufacturing KPI, but the units will differ depending on industry, they could be in tons, gallons, items, etc.
While some KPIs are averaged as they are rolled up to different manufacturing levels, days or months; throughput is added. So, a site would have their goal of units per shift, rolled into units per day, into units per week, per month and per year.
2. On Time Delivery
On time Delivery = (# of units delivered on time/ number of units delivered) *100
On time delivery as a manufacturing KPI speaks to value to the customer. Product delivered on time makes happy customers, and happy customers are returning customers.
This is a lagging measure. Is delivery on time? This won’t be known until after delivery is completed. A more leading measure would be if the items are shipped on time. On time delivery or on time shipment reducing could point to an issue up stream in the process.
3. Yield

Yield is a manufacturing measure on how much sellable product was produced compared to the total amount of product produced. It is an important metric commonly seen on manufacturing KPI dashboards. It breaks down further into two measurements, First Pass Yield and Overall Yield.
First Pass Yield = Number of parts passed w/no failures / total number of parts produced.
First Pass Yield is the best type of product, because no further work needs to be completed on that product. Final Yield gives credit for those units that were able to be reworked in some way to be sold.
It is expected that the first pass yield will be lower than the final yield. First pass yield should not include products that were downgraded and sold as something else, this is still considered a failure and would be captured in the final yield.
By measuring both First Pass and Final Yield a site can see how much extra work is being used to sell all the productions. If final yield is 95% but first pass yield is 50% there is a lot of work that needs to be done. One measure on its own can be misleading.
Final Yield = total number of parts passed / total number of parts produced
4. Maintenance Cost
Maintenance cost is the overall cost to maintain a machine or process. This includes labor, parts, and other invoices. This KPI falls under value to the company, the lower the costs the higher the profit.
This manufacturing KPI can be valuable when trying to determine if a machine is worth running. The total maintenance cost is divided by the number of hours the machine ran.
Maintenance Cost = (Maintenance labor + Parts) / (Hours running)
For a more robust maintenance cost, energy consumption, water and other costs can be included to the formula.
If maintenance costs is a critical KPI for the site, it can be broken down to individual parts. Hour of labor vs. hours of operator, annual parts cost, etc.
5. Overtime Rate
Overtime Rate = overtime hours / regular hours *100
The overtime rate is the amount of overtime vs. regular time hours worked by employees. This metric is both value to the employee and value to the company.
Employees will not have to take their off days to work, and the company will not have to pay an overtime rate. The overtime rate can also help determine if there are any issues with scheduling or staffing.
The point of manufacturing KPIs is to have data and an actual number to look at. Some can feel that there is too much overtime, but without the numbers it is just a feeling, numbers don’t lie.
6. Safety Incident Rate
Incident Rate = Number of incidents * / # hours worked by all employees
Safety incident rate is an important one and brings value to everybody.
It takes time to train new employees. With high incident rate a company could have people missing work or high turnover. New employees go through training, which could reduce production and even lower quality for a duration.
This is one that every company should pay attention to, from manufacturing and transportation jobs to office work.
7. Changeover Time
Changeover Time = Available times – production time
Changeover time tracks the time it takes to move from one product or task to another. The less time it takes to transition between products, more product can be made.
This includes the time it takes to get good quality product, changeover time does not end until good quality product is being made.
This measure can be tracked on a grade or product basis to help identity when products are challenging to move to. Although this is a fairly simple metric, it can have great impact on the process, and opens the door to dive into the ins and outs of product changeover.
A fairly important manufacturing KPI, especially if the site is starting out in the continuous improvement process. Typically, there are some big wins that will not cost much to implement.
8. Waste
Scrape = Waste / Total Material Used *100
Waste in manufacturing can mean waste in time, money, or material. Reducing waste of any type is the primary goal of LEAN manufacturing.

By tracking material or scrape waste and reducing it at a site will increase their yield and reducing cost. Reduced waste means more production/units out of the same amount of material. Saving material and money.
Another bonus of reducing scrap is the site reduces how much waste they have to dispose of, also saving money.
9. Customer Product Returns
Customer Product Returns = Cost of customers complaints (or returns)/ total sales *100
Customer complaints and product returns can help ensure internal quality standards are matching up with customer expectations.
This metric tracks the cost of customer complaints/returns compared to total sales (customers do not always return product, if you are a supplier they may send a bill from their manufacturing for production cost lost due to underperforming product).
This manufacturing KPI provides value to both the customer and the company. The customer gets on quality product, and the company is not pay out return claims.
10. OEE

Some of the manufacturing KPIs from above are part of the OEE formula. Together they create OEE, Overall Equipment Efficiency. The OEE equations calculates availability (includes changeover time and other downtime), Quality (final yield) and Efficiency (throughput or speed loss). How to Calculate OEE: Formulas for Peak Performance takes a deeper dive into the OEE calculation.
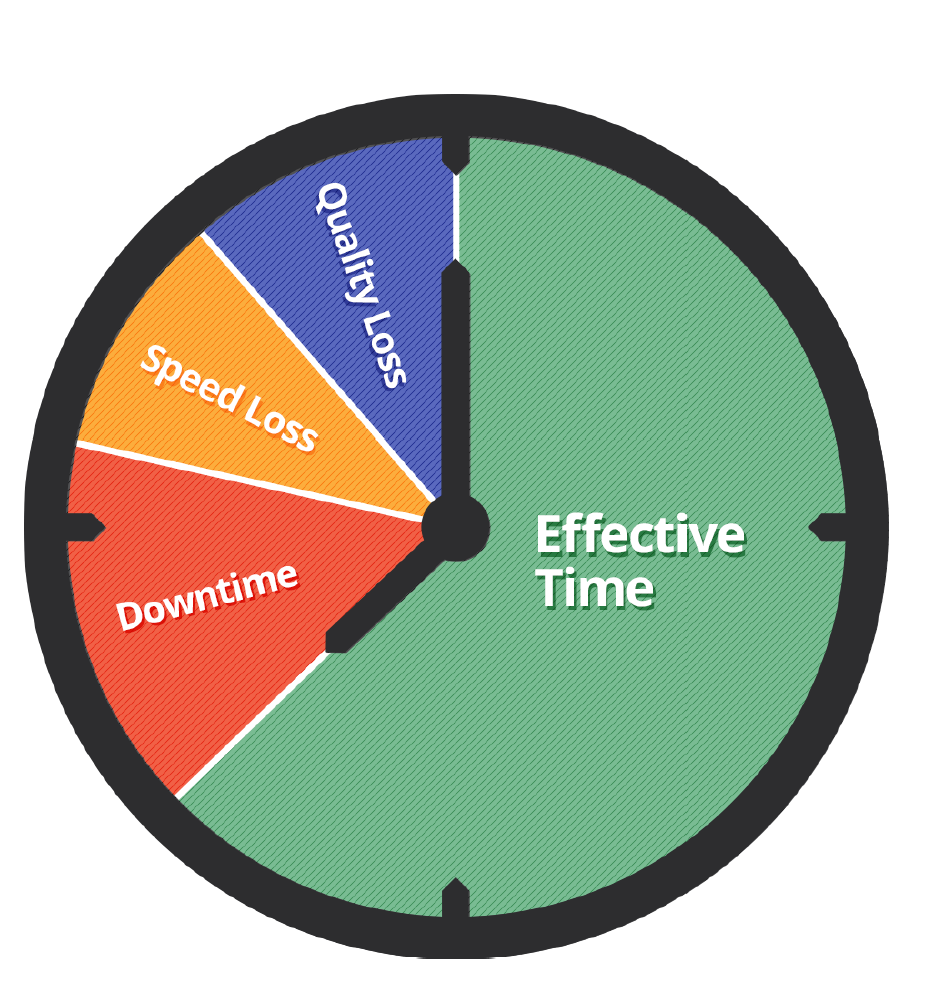
This diagram represents the manufacturing losses used to calculate OEE, a common manufacturing KPI.

Everything you need to successfully implement, analyze, & improve overall equipment effectiveness.
Availability
The availability refers to how long the machine was running. Any downtime that was already scheduled can be removed from the calculation.
Availability = Minutes Up / Available Time
The broken down formula to shown scheduled and unscheduled downtime is as follows:
Availability = (Total Time – Scheduled Downtime – Unscheduled Downtime) / (Total Time – Scheduled Downtime)
Quality
The quality calculation looks at the total parts produced and subtracts out the bad parts produced.
Quality = (Total Parts Produced – Bad Parts) / Total Parts Produced
Efficiency
Efficiency compares the target machine rate to the actual machine rate. The number of parts produced in a given time compared to the goal production. The actual machine rate is a calculation as well.
Efficiency = Actual Production Rate / Target Production Rate
The OEE calculation is the multiplication of Availability, Quality and Efficiency.
OEE = (Availability * Quality * Efficiency)*100
Manufacturing KPIs are only as good as the data. Make sure you know where the data is coming from, and that equations and conversions are accurate when calculating KPIs.
Mastering Manufacturing Metrics
The Ultimate guide to establishing, measuring, & reporting KPIs for peak plant performance.
All the resources you need to successfully implement, analyze, & improve overall equipment effectiveness.